Signal
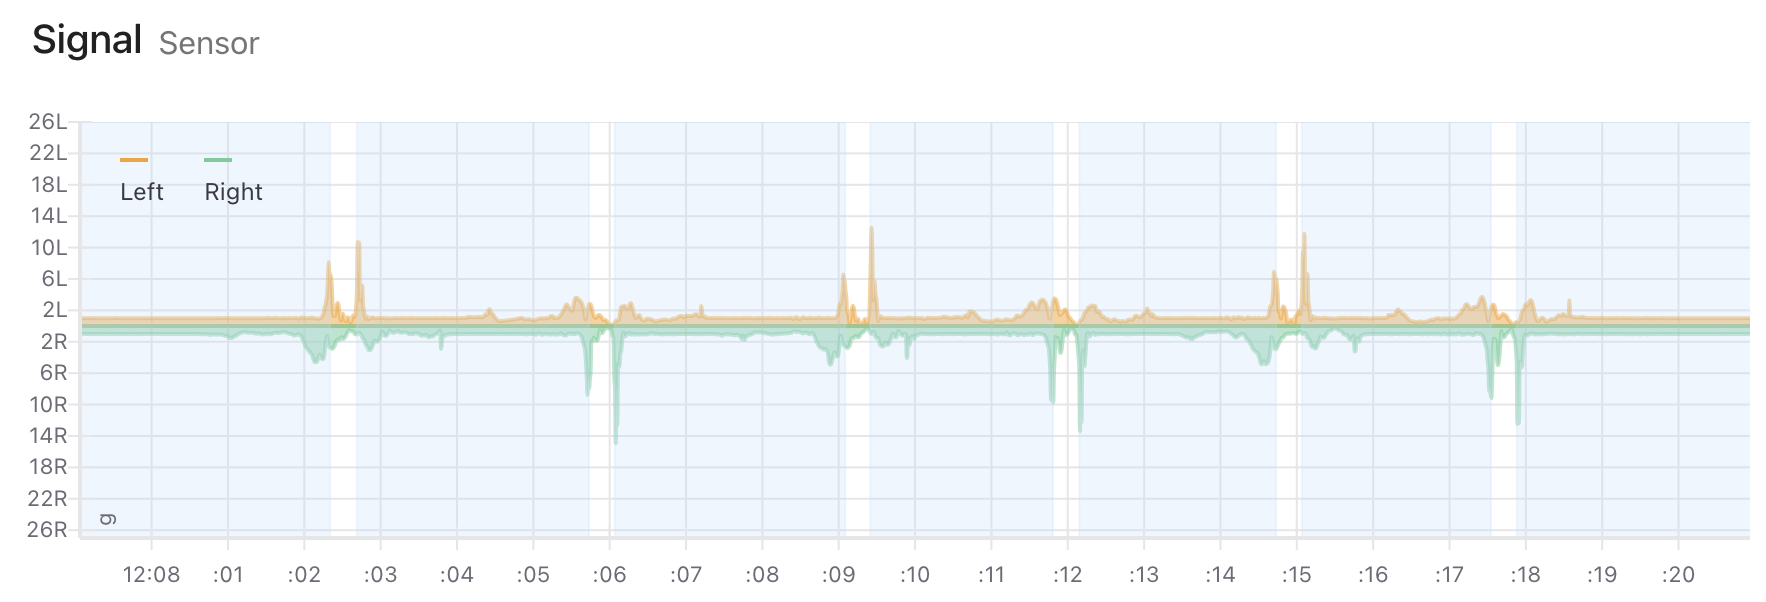
The Signal graph displays the resultant (all 3 axes combined) accelerations of the left foot in the top half of the graph (orange) and the right foot in the bottom half of the graph (green). This graph is useful for assessing general activity trends, like when jumps occurred and shapes of the movement patterns. Below is a typical Signal graph for a single leg jump for height (SLJ-H) test:
Signal graph for a SLJ-H test
The blue sections indicate sections of the activity that were not jumping. These sections are omitted from the summary calculations.
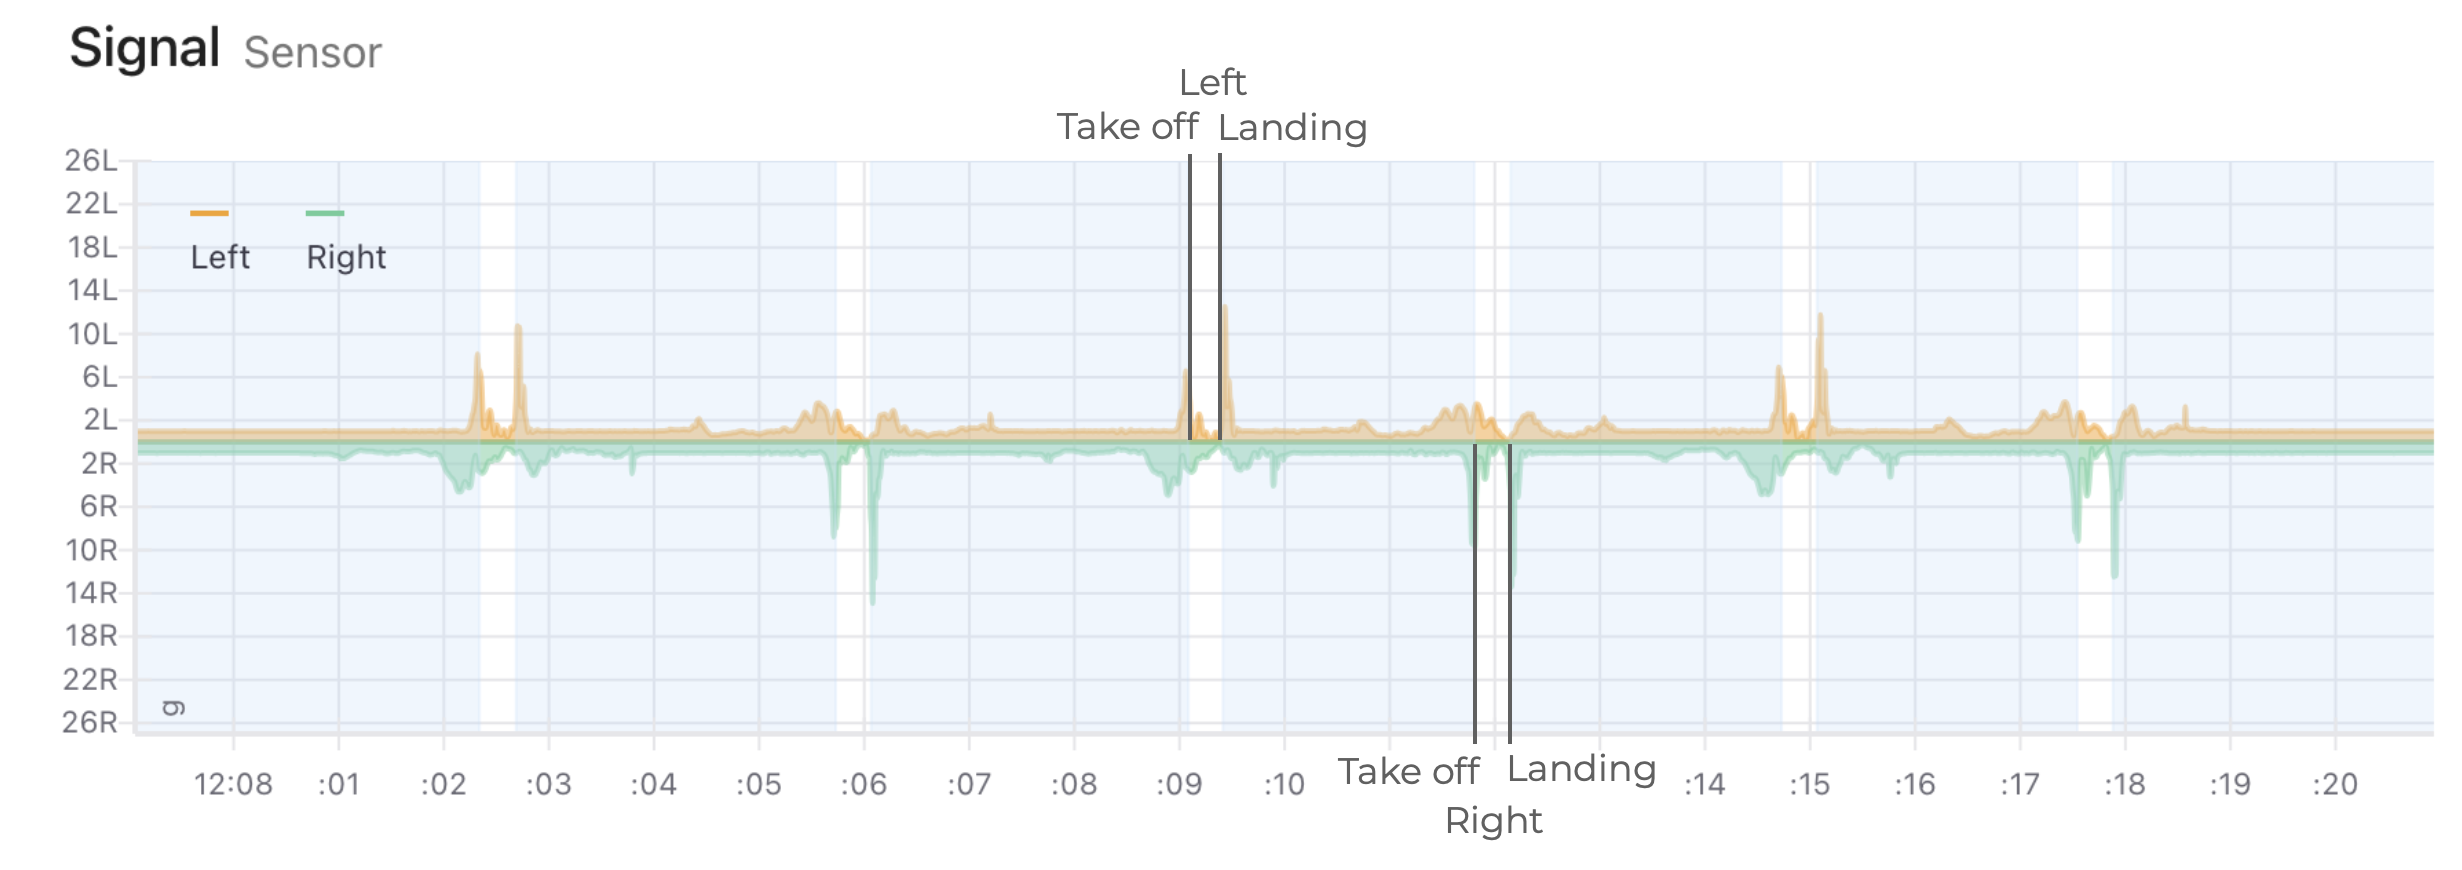
The main features that are visible in the Signal graph are the take off and landing. Some individuals will present different take off and landing shapes on each foot. Before drawing any conclusions from this, make sure to check that this is a persistent pattern throughout the whole activity, and not a one off.
Jump phases in the Signal graph


