
Understanding g-Load: The Measure of Mechanical Stress on Athletes
When athletes train and compete, their bodies absorb tremendous load with every step, jump, and change of direction. Traditional metrics like distance and time tell part of the story. But they miss something critical: the actual mechanical load imparted on the body from the ground.
That's where g-Load comes in.
What is g-Load?
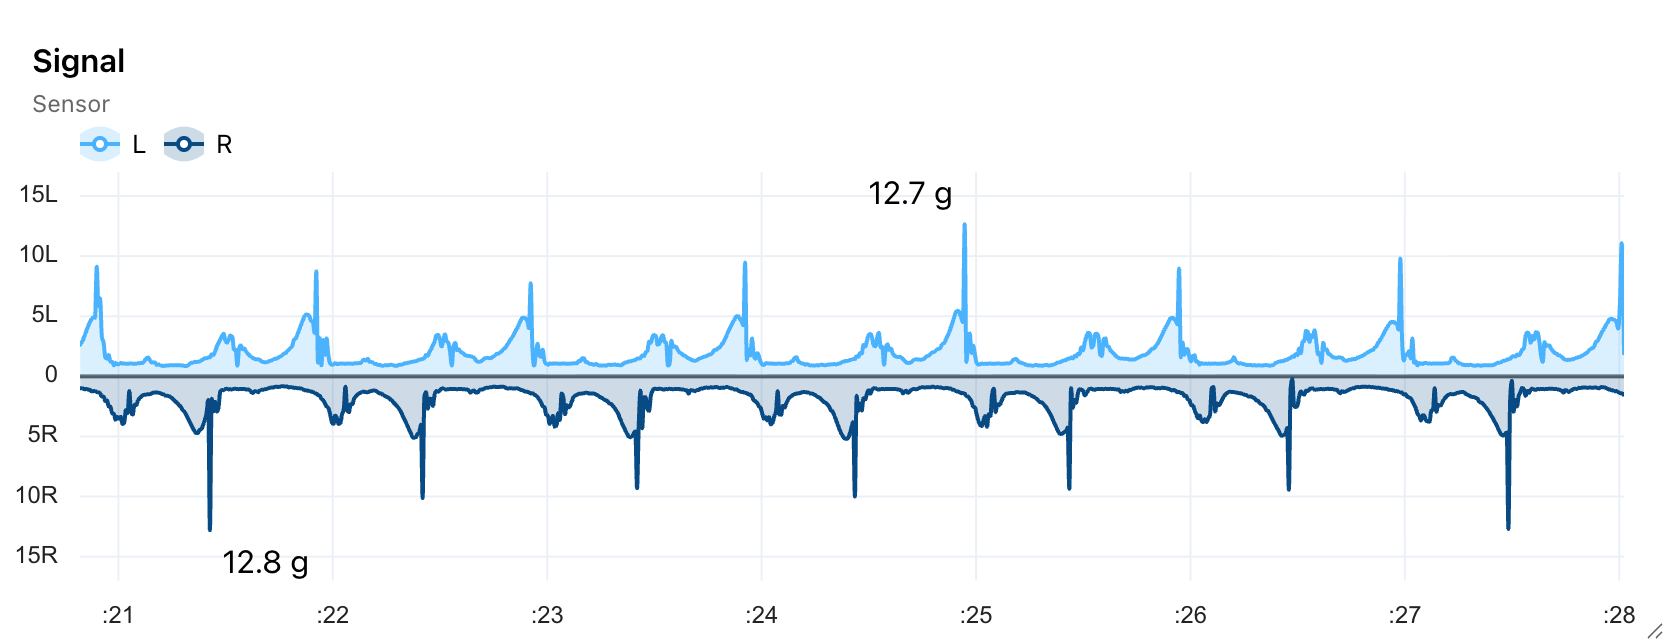
Acceleration signal of walking
g-Load measures the accumulated mechanical stress your body experiences during movement. It captures the peak accelerations at two critical moments: foot strike (impact) and toe off (push-off).
The sensor outputs these measurements in g's—the same unit that describes acceleration due to gravity. Harder impacts produce higher acceleration peaks. More intense movement creates greater accumulated load.

The Physics
Our 32 g IMU sensor is at the foot-ground interface, capturing acceleration data with each step. The result? A direct measurement of lower limb load that no GPS, optical tracking system, LPS, or chest-worn device can capture.
There's no black box here. g-Load is simply the g's — raw acceleration data — from the point where your body meets the ground.
Why g-Load Matters
Different surfaces, speeds, and movement patterns create vastly different loads on your body. Running on cement produces higher g's than running on grass. A harder strike generates higher peaks than a softer landing.
This matters because cumulative load drives adaptation and fatigue. Athletes who understand their load patterns can optimize training intensity, reduce injury risk, and enhance recovery strategies.
Beyond Total Numbers: Intensity and Context
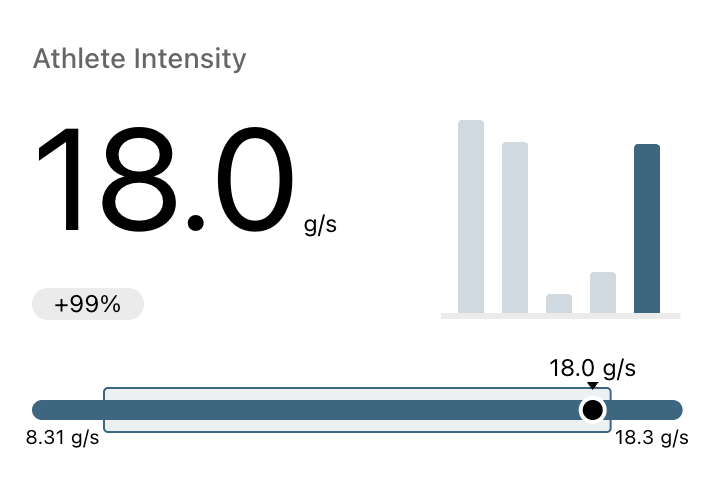
Raw g-Load tells you about total work done, but context matters. That's why we pair it with athlete intensity—g-Load per second.
A 300,000 g session over 60 minutes represents different physiological stress than a 300,000 g session over 30 minutes. Intensity normalizes for session length, revealing a different angle on how the load was accumulated.
The Power of Bilateral Monitoring

Here's what makes g-Load uniquely valuable: we measure both feet independently.
This reveals asymmetries in how you land and push off. Higher push-off asymmetry might indicate reduced propulsive ability on one side. Higher impact asymmetry could signal poor energy absorption or a protective compensation pattern.
These insights are invisible to single-sided or trunk-mounted systems.
Breaking Down g-Load: Push-Off and Impact
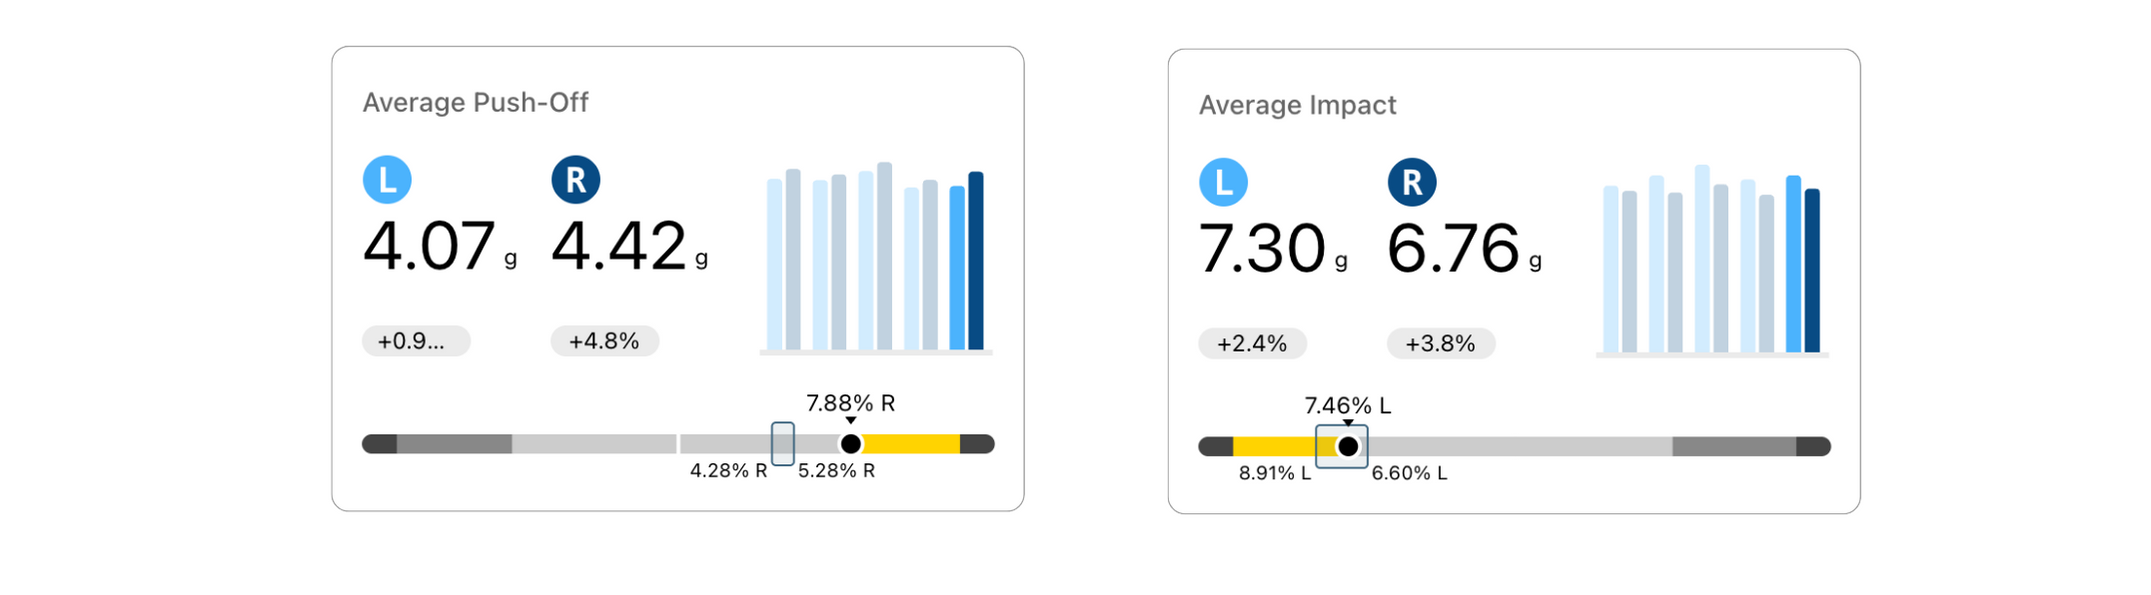
g-Load isn't just a single number. We split it into two fundamental components of locomotion: push-off and impact.
Push-off measures the peak accelerations as your foot leaves the ground. This quantifies your propulsion phase—the strategy your body uses to generate force and drive forward. This is your acceleration system.
Impact captures the peak accelerations when your foot strikes the ground. This represents the absorption phase of movement, as your foot contacts the ground.
The Foundational Model: GRIN

Acceleration signal of walking with the output of GRIN overlayed. The grey bars indicate when the foot is off the ground.
Our ability to precisely capture impact and push-off relies on one of our foundational machine learning models called GRIN (Ground Interaction). GRIN classifies each IMU data point as on-ground or off-ground, enabling us to isolate the exact moments when your foot contacts and leaves the ground.
Once GRIN identifies these instances, we extract the peak resultant acceleration across all three axes of the IMU. This tri-axial measurement captures the complete acceleration vector—not just vertical loading, but the full three-dimensional acceleration signature of how your body interacts with the ground.
Why This Matters
These two metrics tell fundamentally different stories about movement health:
Push-off patterns reveal propulsive capacity. Elevated push-off asymmetries frequently correlate with Achilles or foot injuries. When one side leaves the ground at a different rate than the other, it might signal reduced propulsive ability or a compensatory movement pattern where the athlete pulls the leg through rather than pushing off the ground.
Impact patterns reveal absorption capacity. Athletes with knee issues often show elevated impact asymmetries. When one limb lands more stiffly than the other, it can indicate poor energy absorption on one side or a protective strategy to offload that limb.
Movement Strategy at a Glance
By tracking both metrics, practitioners can identify movement compensations before they become problematic. An athlete might maintain normal g-Load while showing concerning changes in how they distribute that load between impact and push-off, or between left and right sides.
This granularity transforms load monitoring from simple volume tracking into strategic movement analysis. You're not just seeing how much work an athlete did—you're seeing exactly how they did it.
Real-World Application: Professional Women's Basketball
Recent analysis of professional women's basketball 3-on-3 versus 5-on-5 demonstrates how g-Load reveals sport-specific demands:
3-on-3 basketball
Average g-Load:
3-on-3 games: 75-93k G
5-on-5 games: 100-130k G
Average Game Time:
3-on-3 games: ~1 hr
5-on-5 games: ~2 hr
At first glance, 5-on-5 appears more demanding from a load perspective, but when you look at it in the context of time, 3-on-3 games accumulate 75% of the 5-on-5 games in only 50% of the time. There is less down time in 3-on-3 and more accelerations and decelerations, making it a more explosive style of basketball than the traditional 5-on-5.
This insight transforms training. 3-on-3 athletes need repeat power and rapid recovery between explosive bursts. 5-on-5 athletes need greater endurance capacity alongside their power output.
Moving Forward
g-Load represents a fundamental shift in how we quantify athletic work. Distance and time describe where you went and how long it took. g-Load describes what your body actually experienced.
It's measurement at the source—direct, transparent, and actionable.
Whether you're managing professional athletes or optimizing your own training, understanding mechanical load opens new pathways to performance and longevity.