Managing performance
after injury is how careers are
confidently built or quietly lost.
Plantiga is the AI movement intelligence layer that fills the on-court, on-field,
and on-ice blind spots in return-to-performance and injury prevention.
Managing performance after injury is how careers are confidently built or quietly lost.
Plantiga is the AI movement intelligence layer that fills the on-court, on-field, and on-ice blind spots in return-to-performance and injury prevention.
“Every other tool tells us what the athlete did. Plantiga tells us how they did it - on the court, where it matters most.”
- Dr. Andrea Hudy, Head of Performance,
Women’s Basketball NCAA


Solve three of the biggest challenges in
high-performance athlete management
with one unified system
1. Return-to-Play
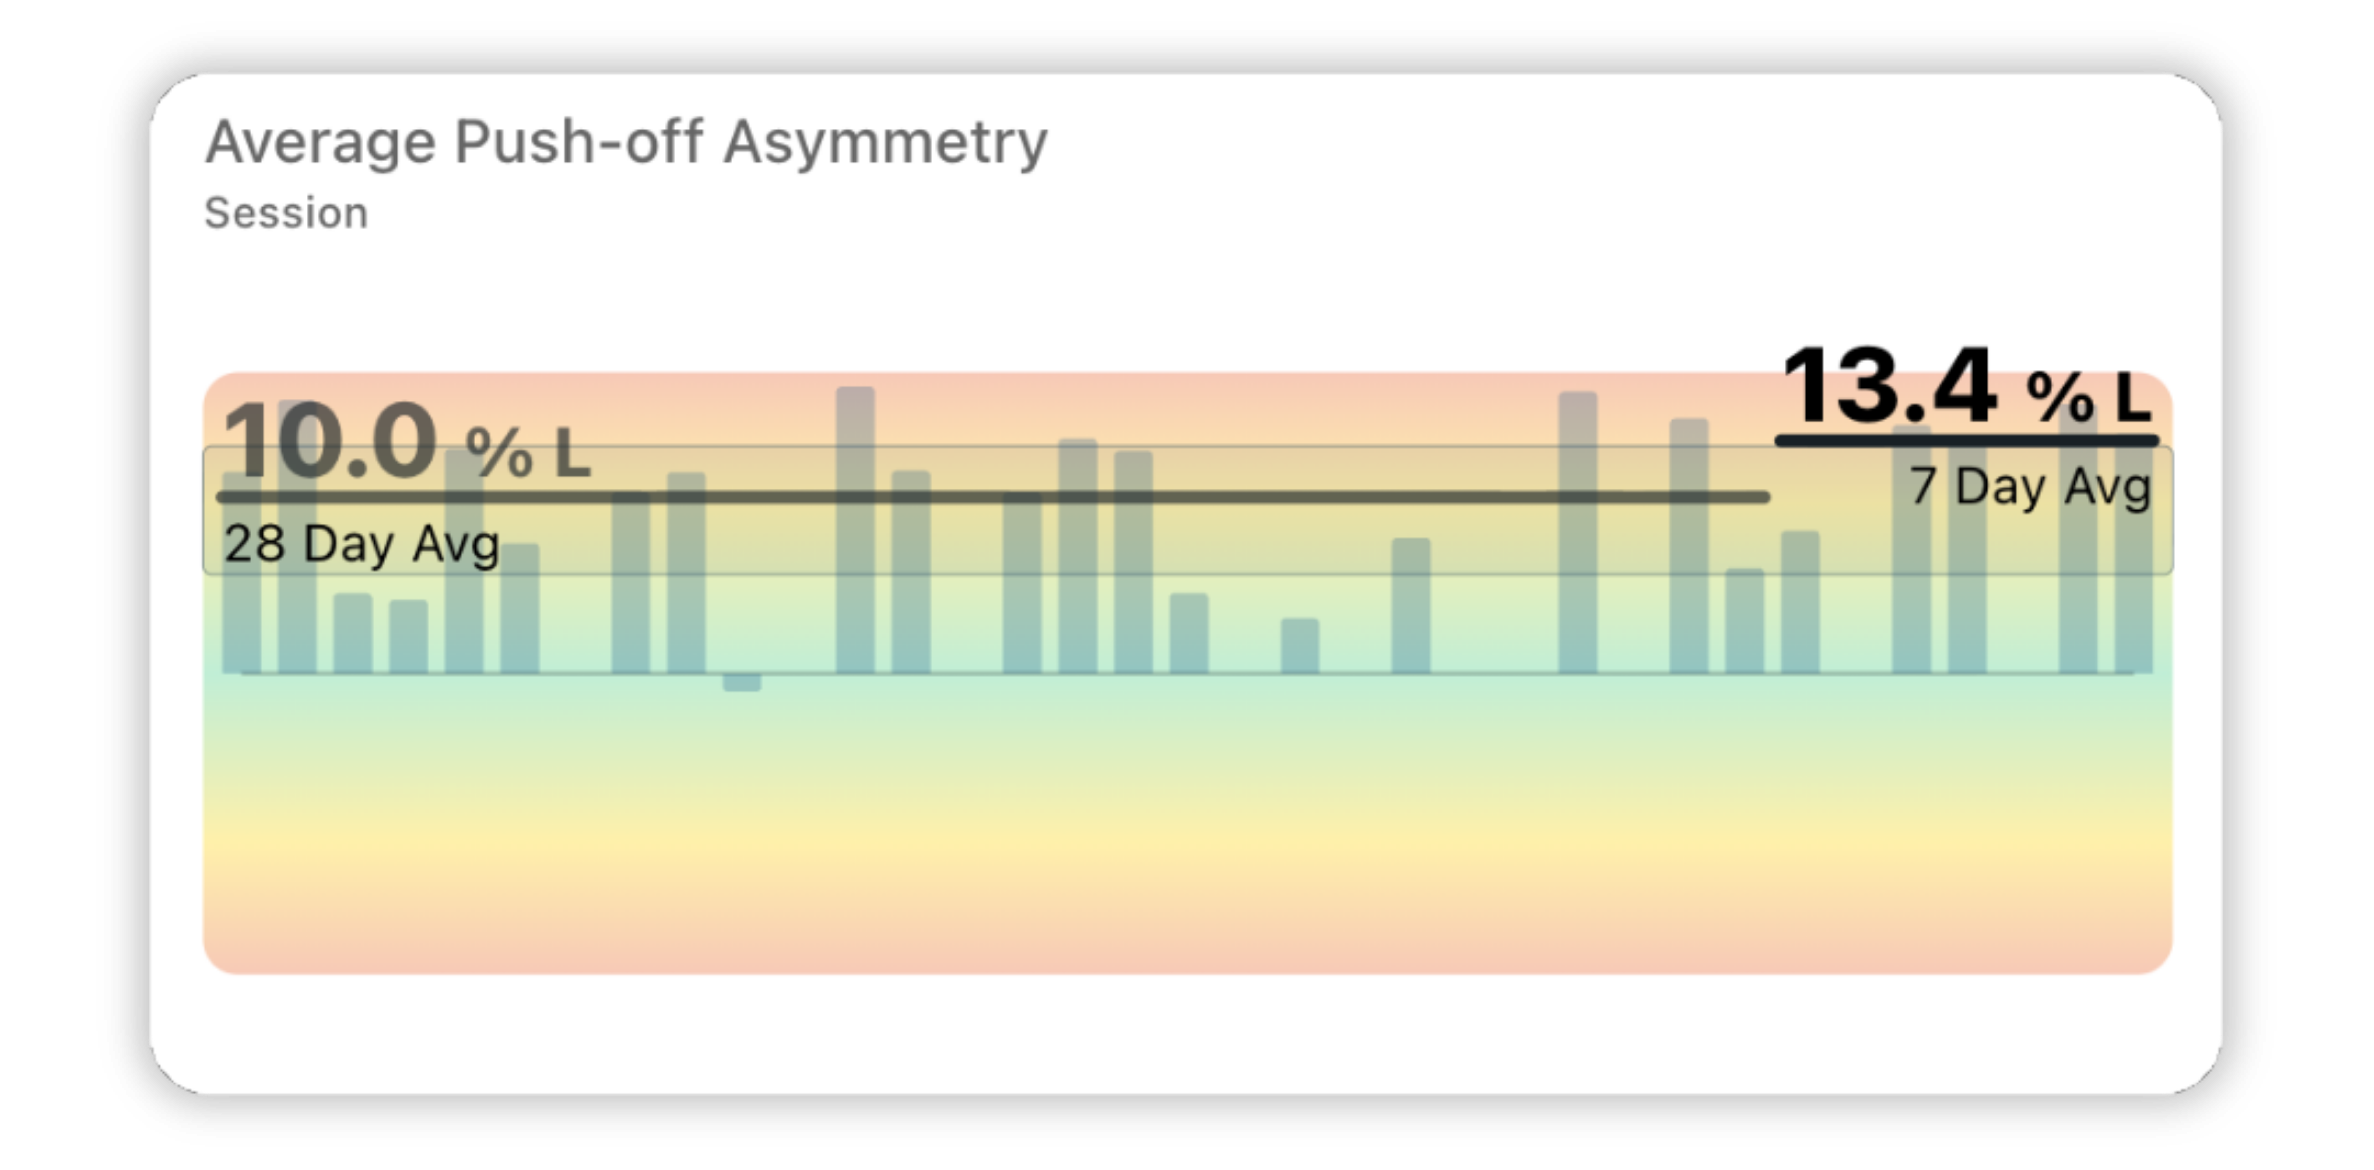
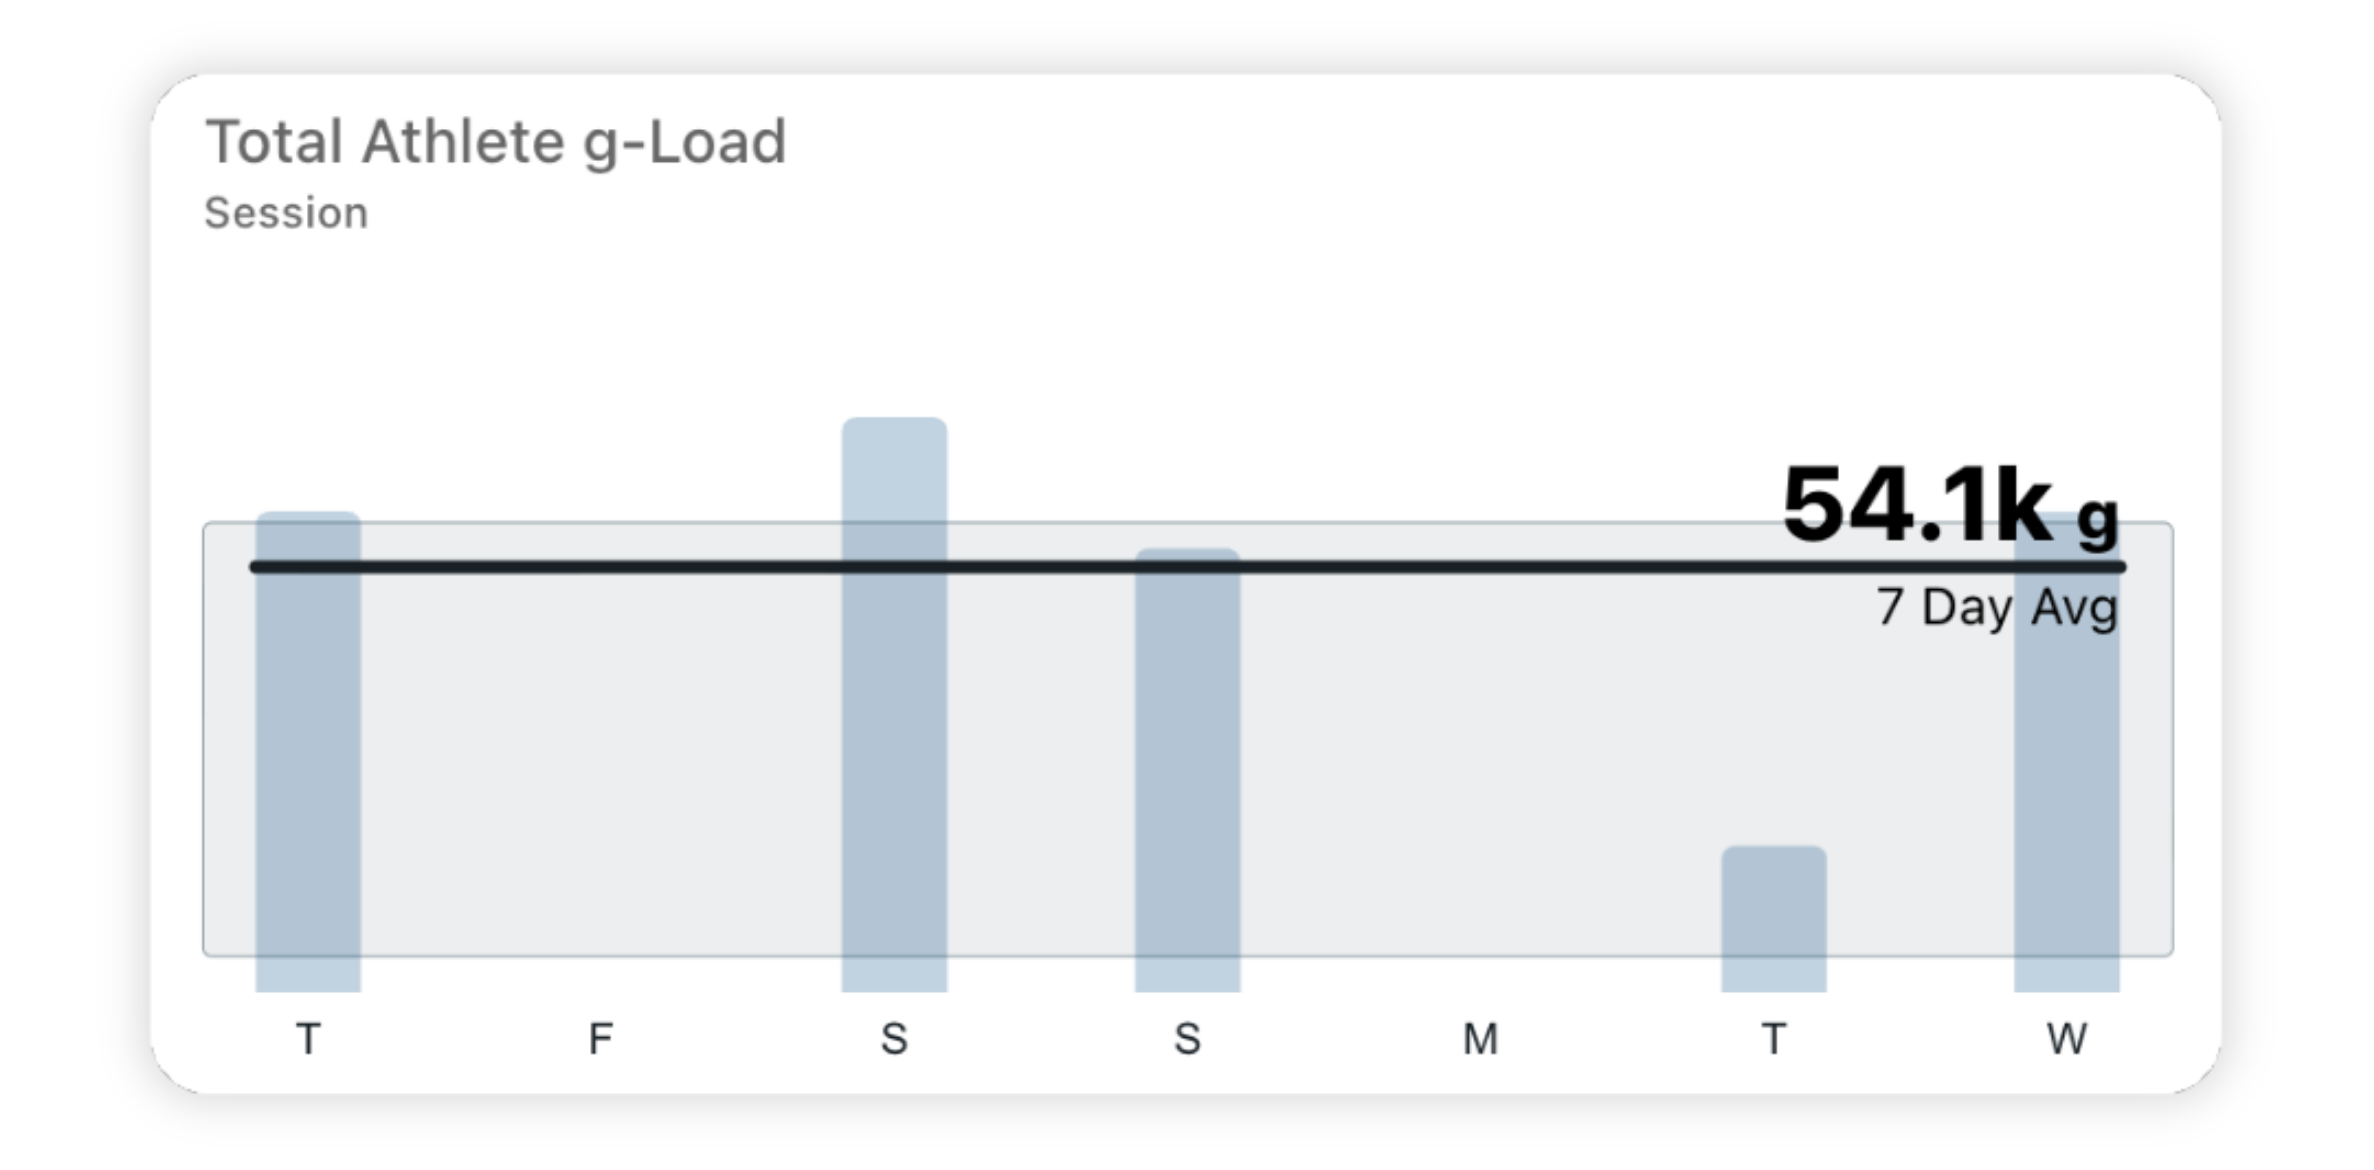
Make confident RTP decisions with objective data. Validate functional readiness, asymmetries, and load tolerance in actual competition environments: on-court/on-field/on-ice/on-track.
2. Injury Prevention
Move beyond reactive injury tracking. Norman.ai provides continuous biomechanical surveillance, flagging subtle micro-changes and asymmetries before they escalate.
3. Performance Longevity
Sustain peak performance throughout demanding seasons. Optimize daily mechanical load and preserve efficient movement patterns to reduce cumulative fatigue.
Extensively validated against gold standards.
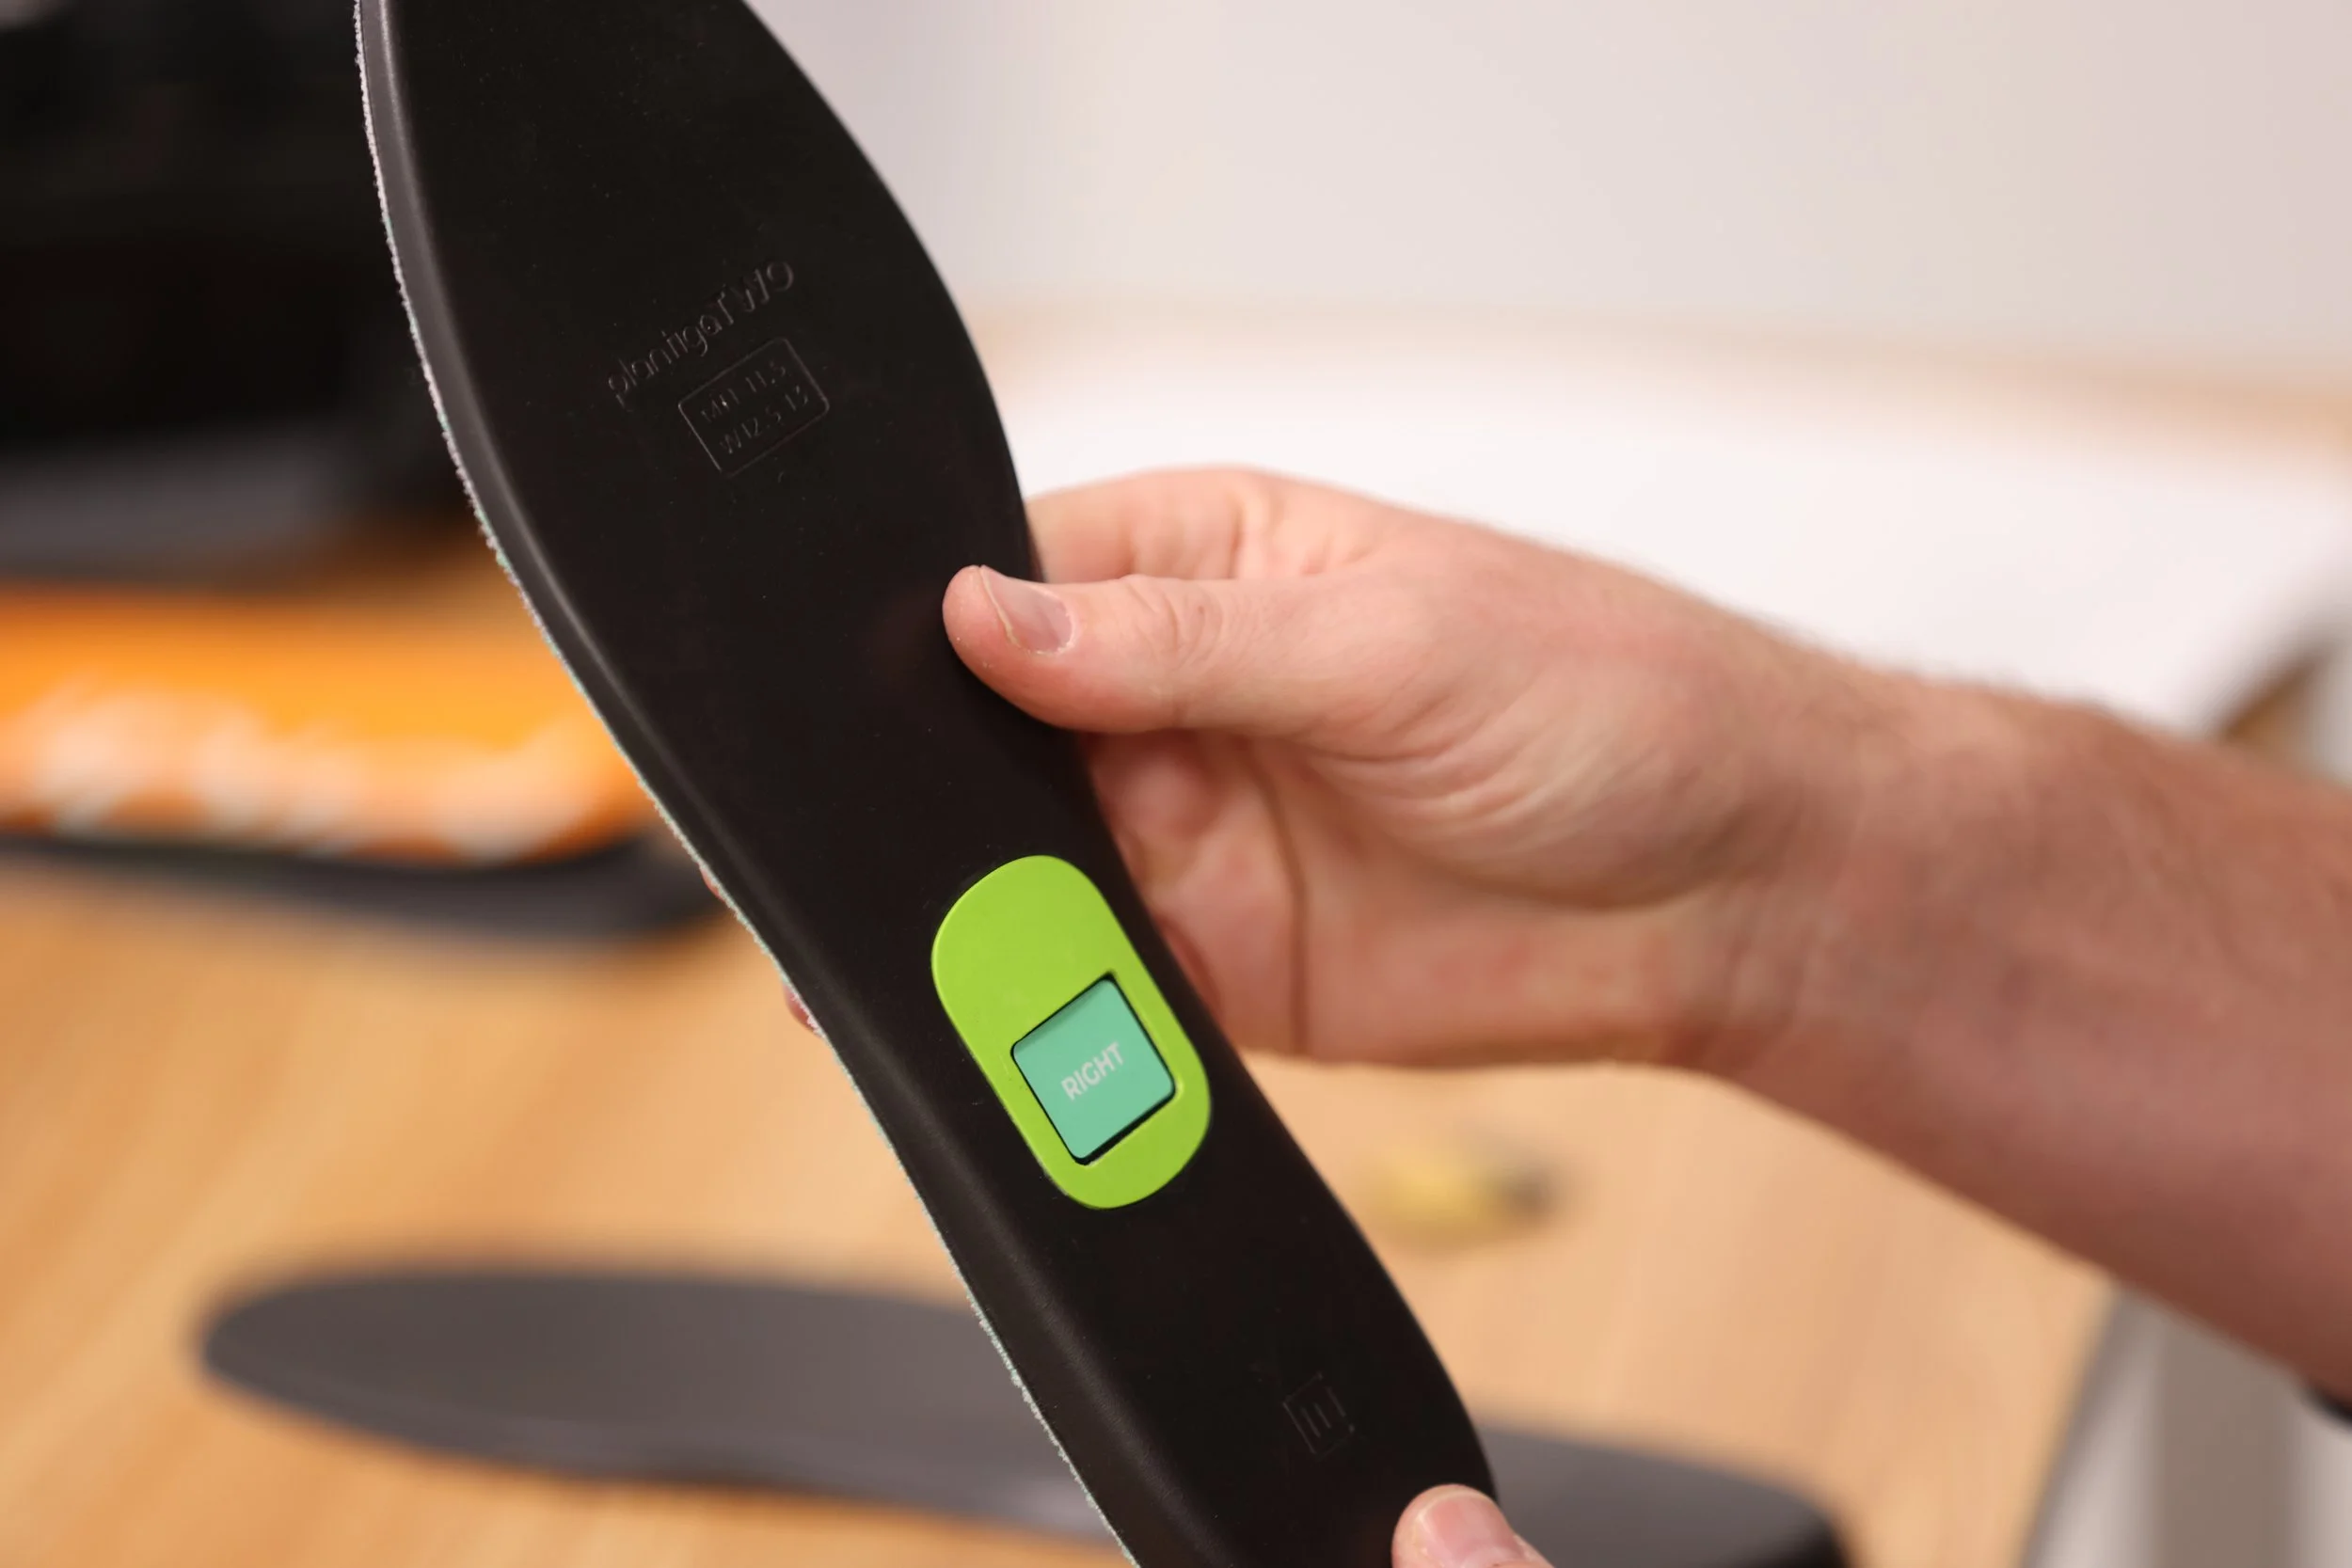
Only in-shoe sensor approved for player use by the NBA.
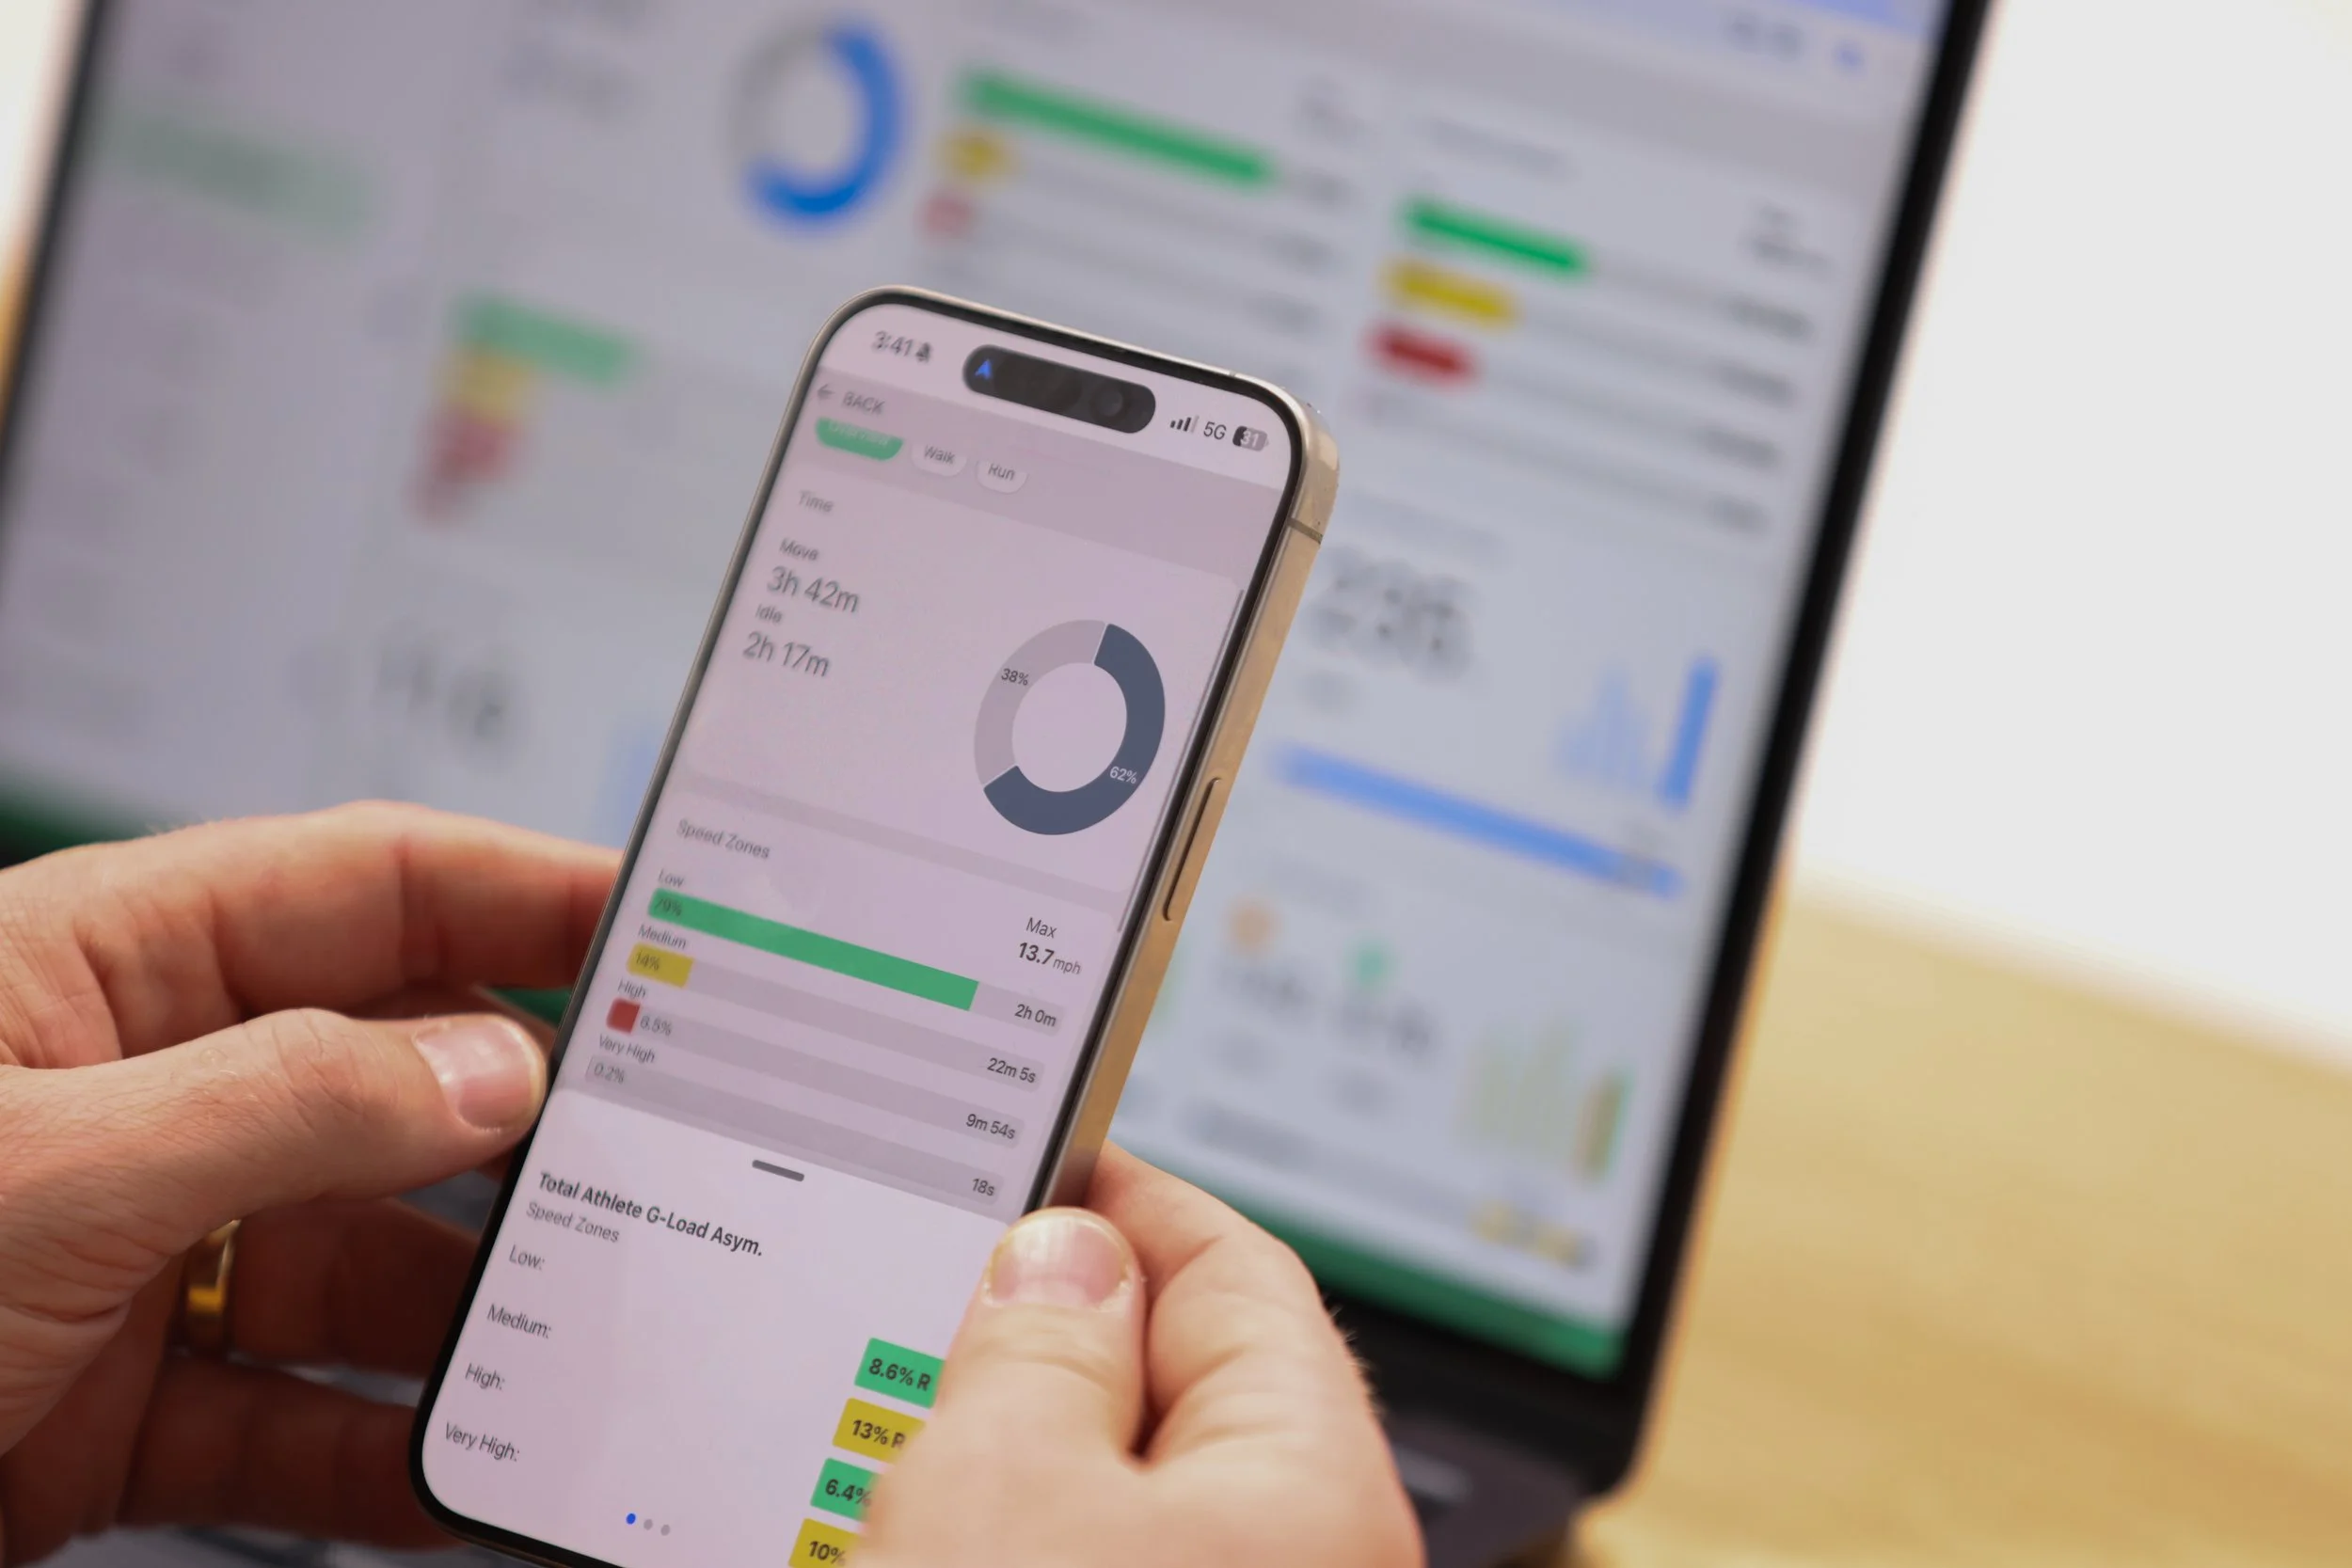
Monitor Everywhere
Capture asymmetries and load data wherever athletes train - at home, on the road, in the clinic, or on the court, field, ice, or track.


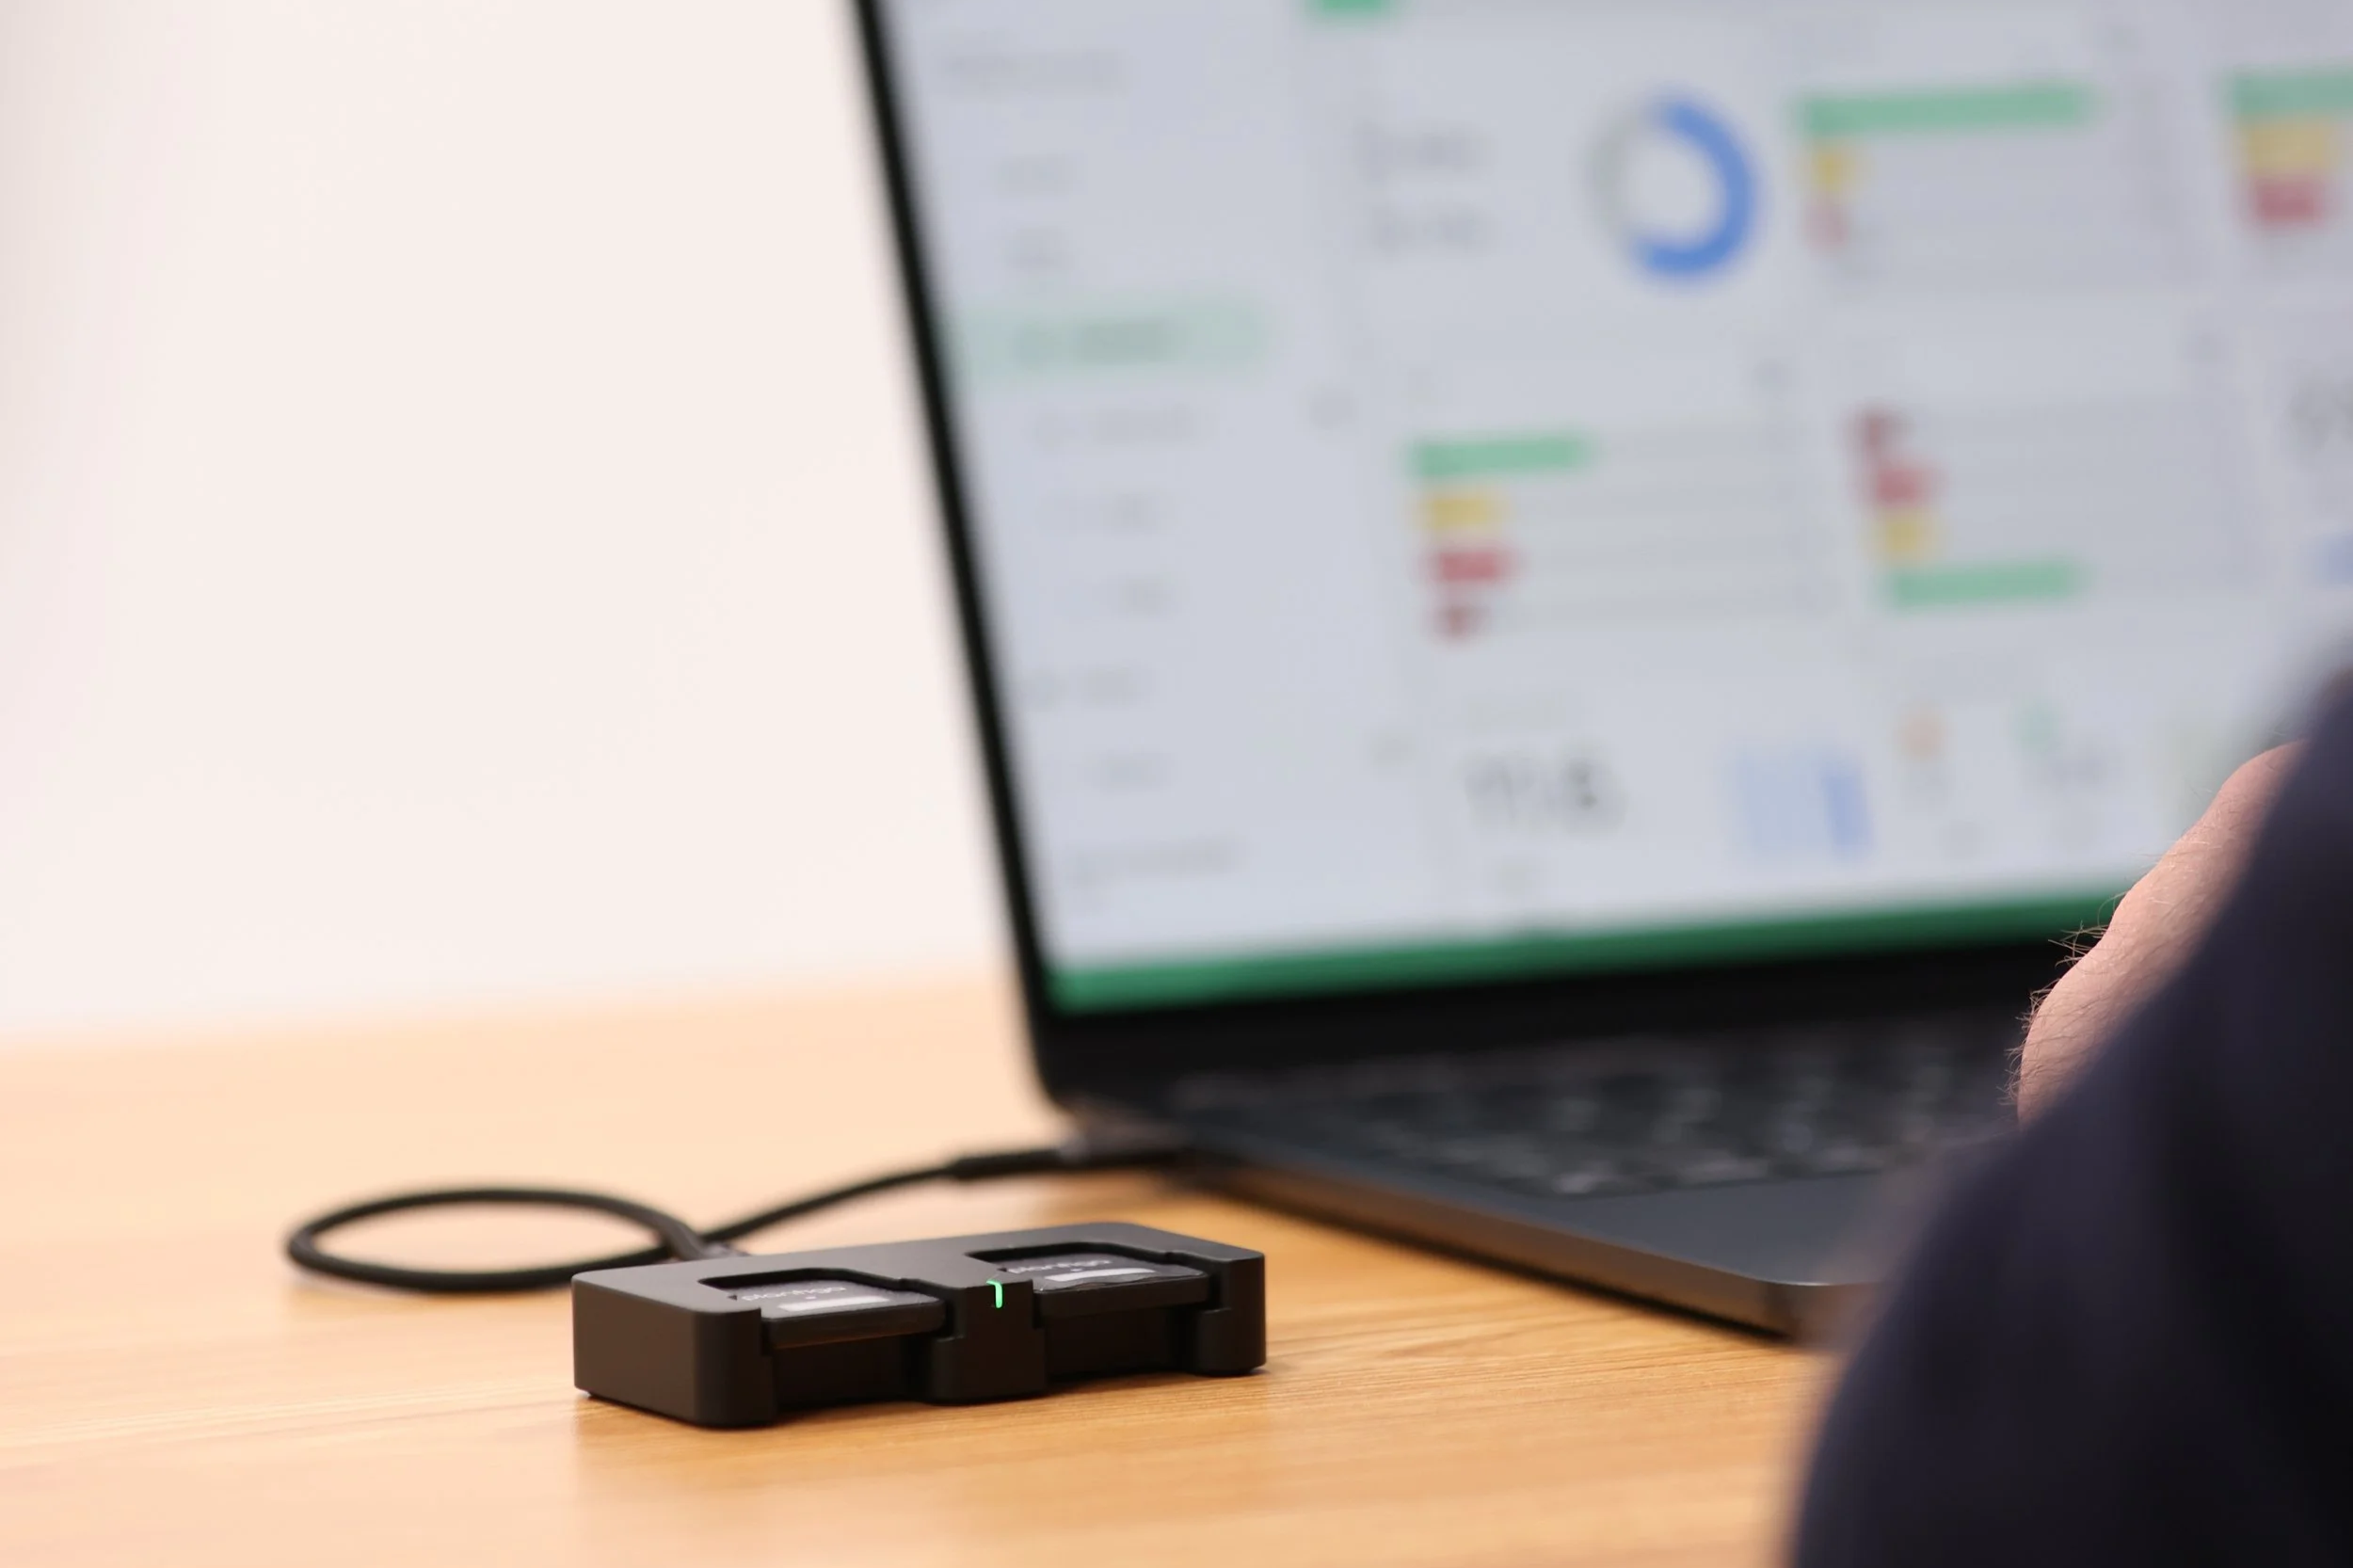
The Movement Intelligence Platform
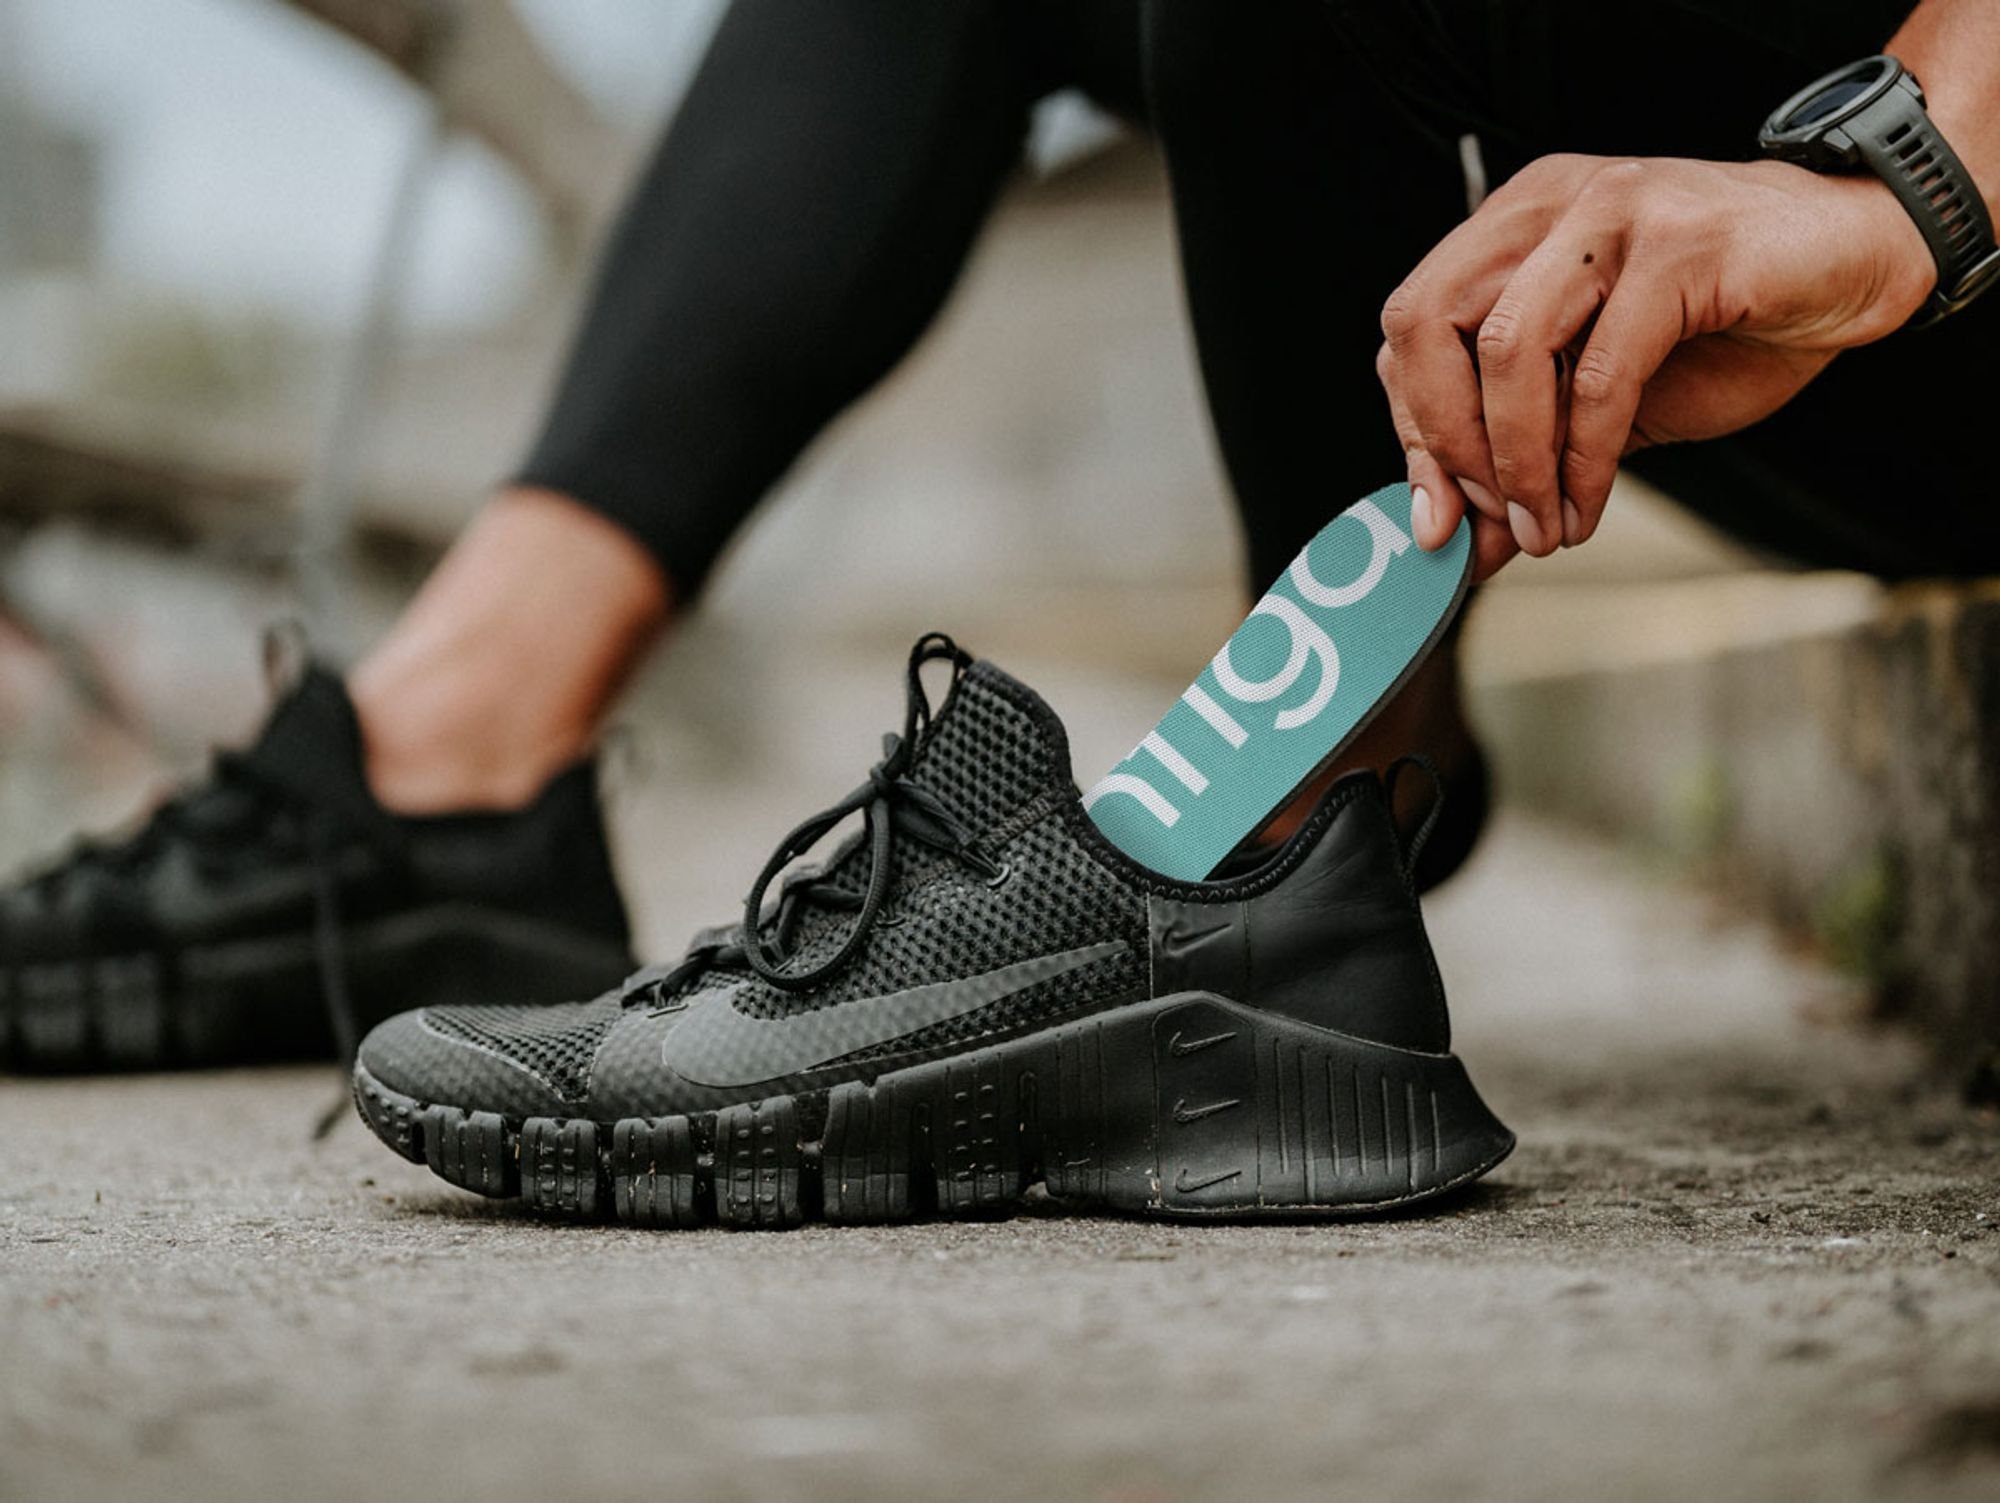
SENSORS
IMU sensors embedded in insoles/orthotics/shoes capture precise movement asymmetries, loads, and variabilities across all movement types.
+
AI

Norman.ai creates movement signatures, detects activities automatically, flags deviations, and delivers actionable movement insights.

Use Best-in-Class Data
Make confident return-to-play decisions with precise lower-body asymmetry and mechanical load data.

Gabe Landeskog’s Return to the Ice
Plantiga supported Gabe Landeskog’s long road back to the ice, guiding a recovery from an injury that only a handful of athletes have ever made.


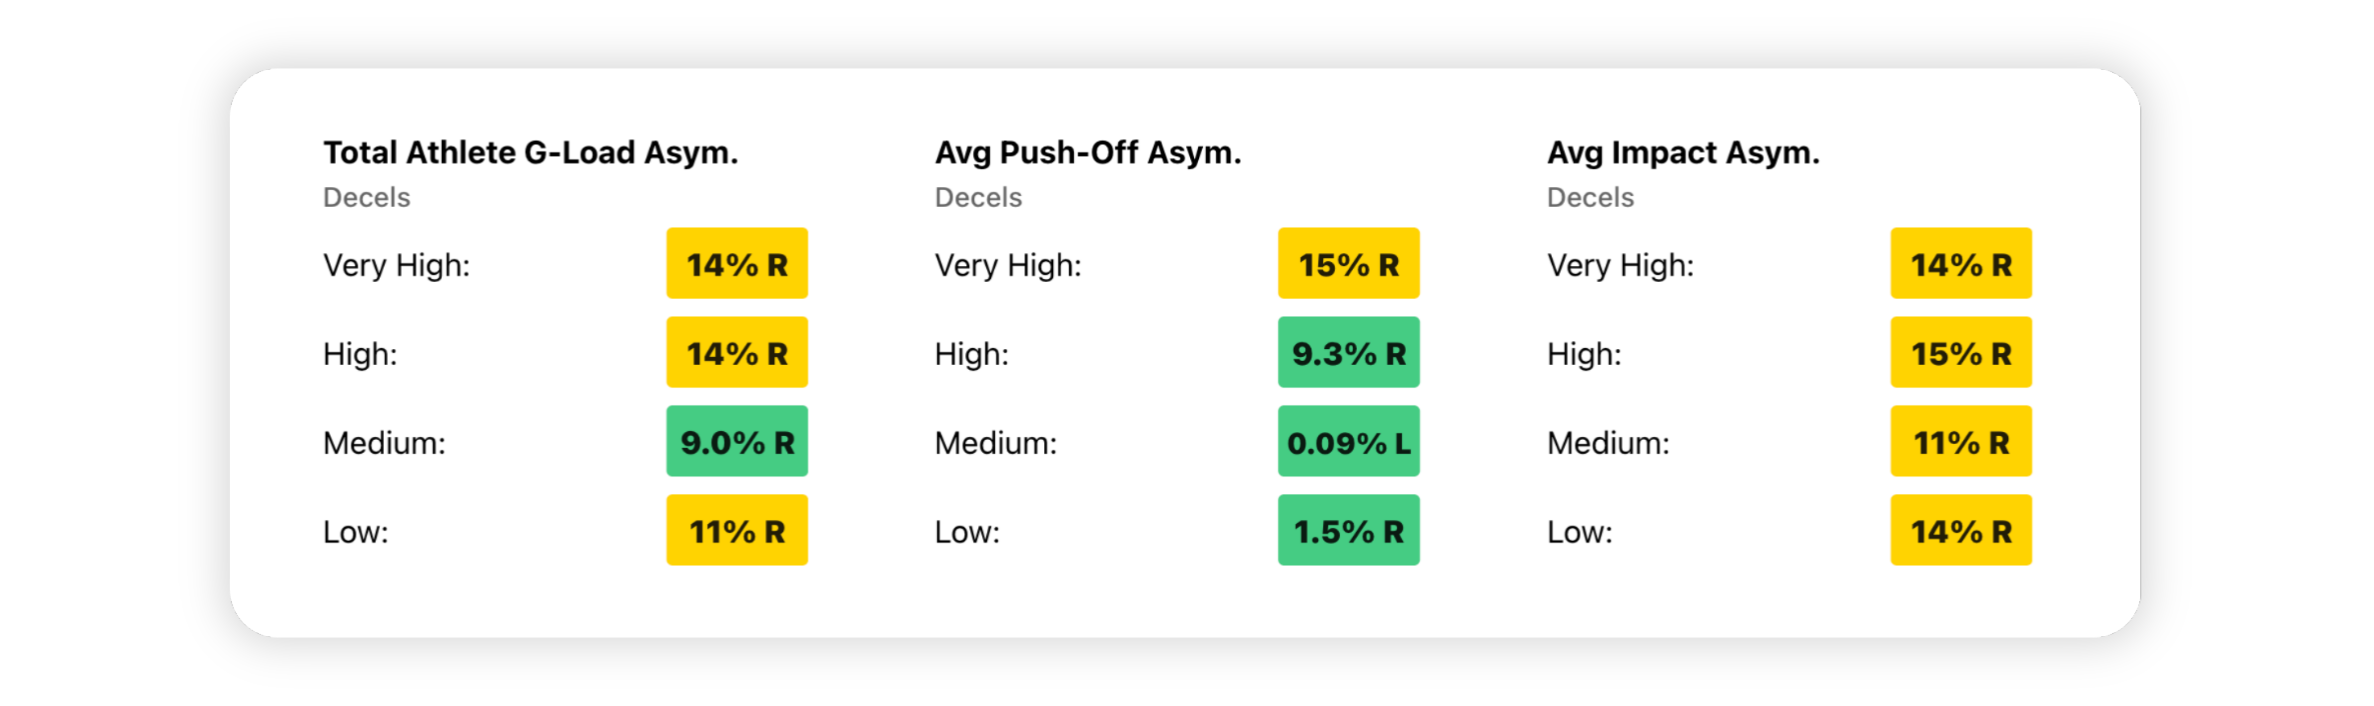
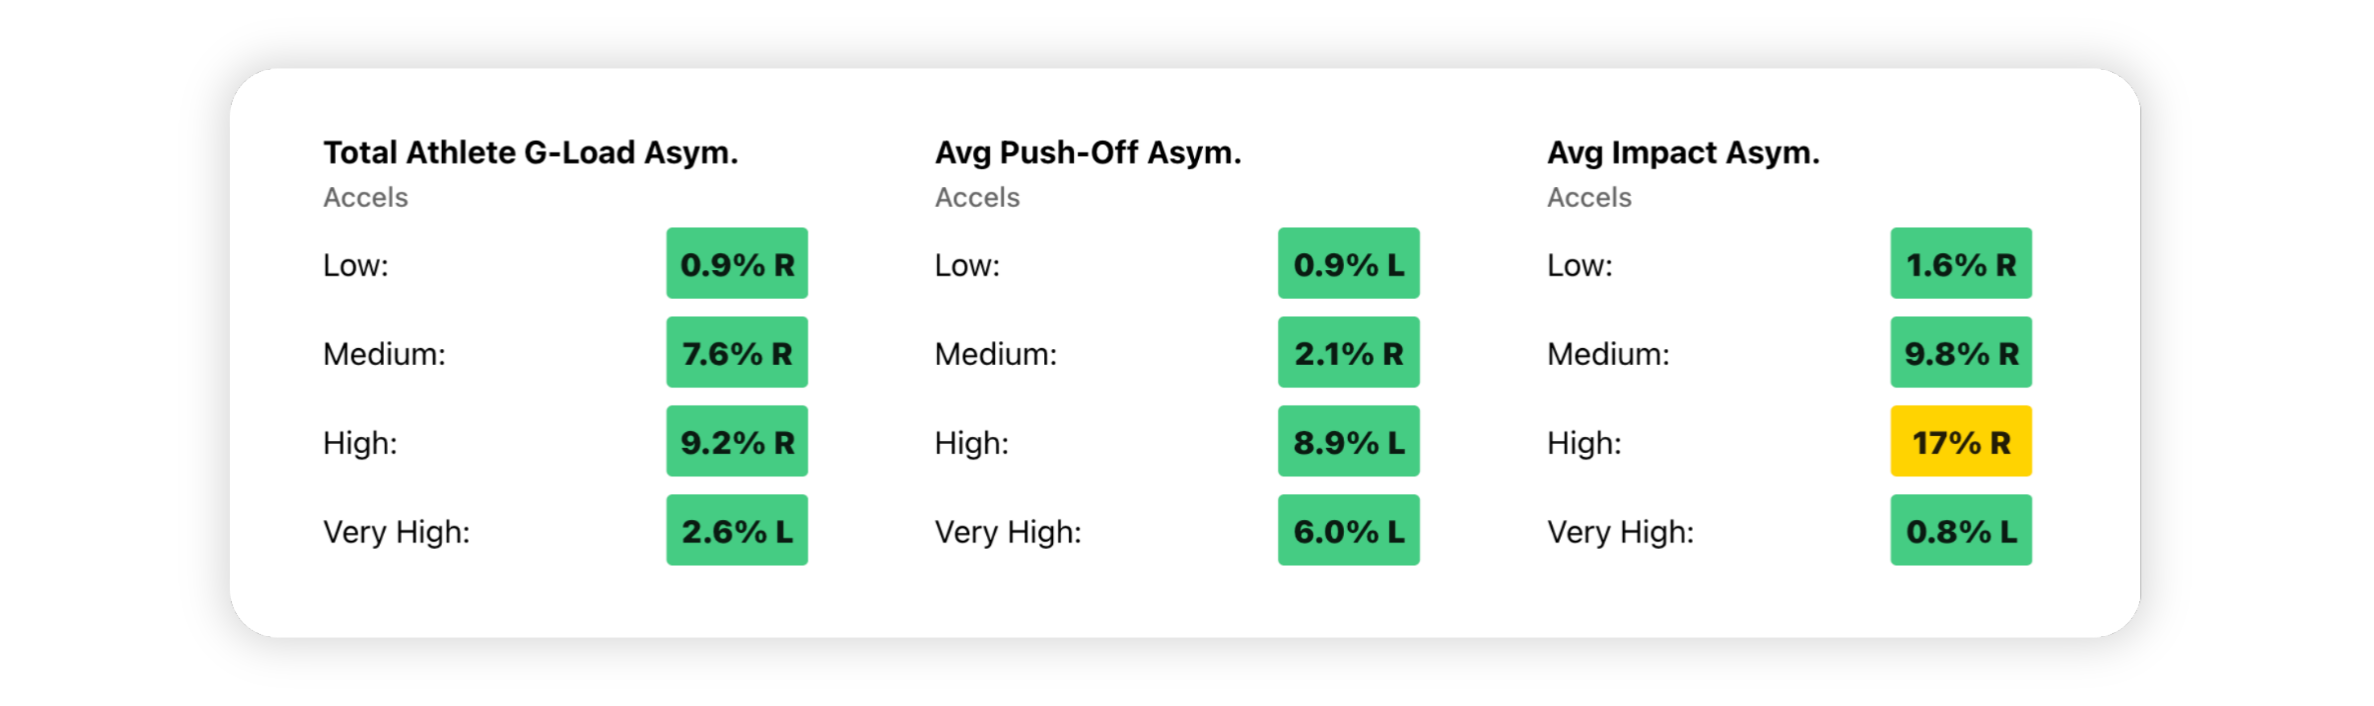
Leave Nothing
to Chance
Profile every movement type - acceleration, deceleration, walking, jumping, running, cutting. Make data-driven decisions with confidence.
Plantiga is
made for:
Complete Your Tech Stack
Fill the gaps between GPS, motion capture, and force plates by adding a real-world movement intelligence layer.
Read how athletes and practitioners across professional and collegiate sports integrate Plantiga into their day-to-day.
Plantiga in Action
-
![Black and white headshot of Jess Elis]()
"I love how Plantiga does on-court return-to-play monitoring, enabling a deeper look at movement asymmetries, ground contact times, and loads. Collecting this data where our athletes actually compete has been a game changer in the RTP process."
Jess Ellis
Former VP Health
NBA -
![Black and white headshot of Dr. Andrea Hudy]()
"Plantiga has given me a better understanding of the loads and movement strategies used by my athletes. It provides me with data-driven injury insights that I can pass along to my performance and rehab teams. It’s been critical in injury prevention and rehabs for us."
Andrea Hudy
Director of Sports Performance
Women’s Basketball NCAA -
![Black and white headshot of Dr. Brandon Stone]()
"Plantiga provides reliable, step-by-step gait information across the movement spectrum that allows us to understand how our athletes move and quantify changes over time."
Brandon Stone
Coordinator of Performance Science
Colorado Rockies -
![Black and white headshot of Brent Salazar]()
"I get excited every time we use it. It has transformed how we monitor, assess, and track our group’s health and injuries. It comes with us everywhere."
Brent Salazar
Former Director of High Performance
USTA -
![Black and white headshot of Ceara Larson]()
"We had a player that always seemed to get out by a step or two. Using Plantiga we were able to uncover why, make some changes, and help him run more efficiently to get on base more."
Ceara Larson
Former Performance Science Operations
Blue Jays