
Impact
Impact is the peak acceleration as the foot contacts the ground. It is calculated on the left and right on every foot strike, and is a means of quantifying the strategy used to absorb energy. There are 4 Impact metrics:
Impact Magnitude
The magnitude of impact is the resultant acceleration value. It can be displayed for the left and right independently, or as an averaged value. Each data view can be useful for answering different questions.
The averaged value makes it easy to identify global trends over time, and keeps graphs clean when you have multiple activity types on the same plot. In the Avg Impact graph below, you can see that this athlete’s impact has increased from Oct 20 to Nov 24. In this case, that indicates improving load capacity, as this athlete is rehabbing from an injury.
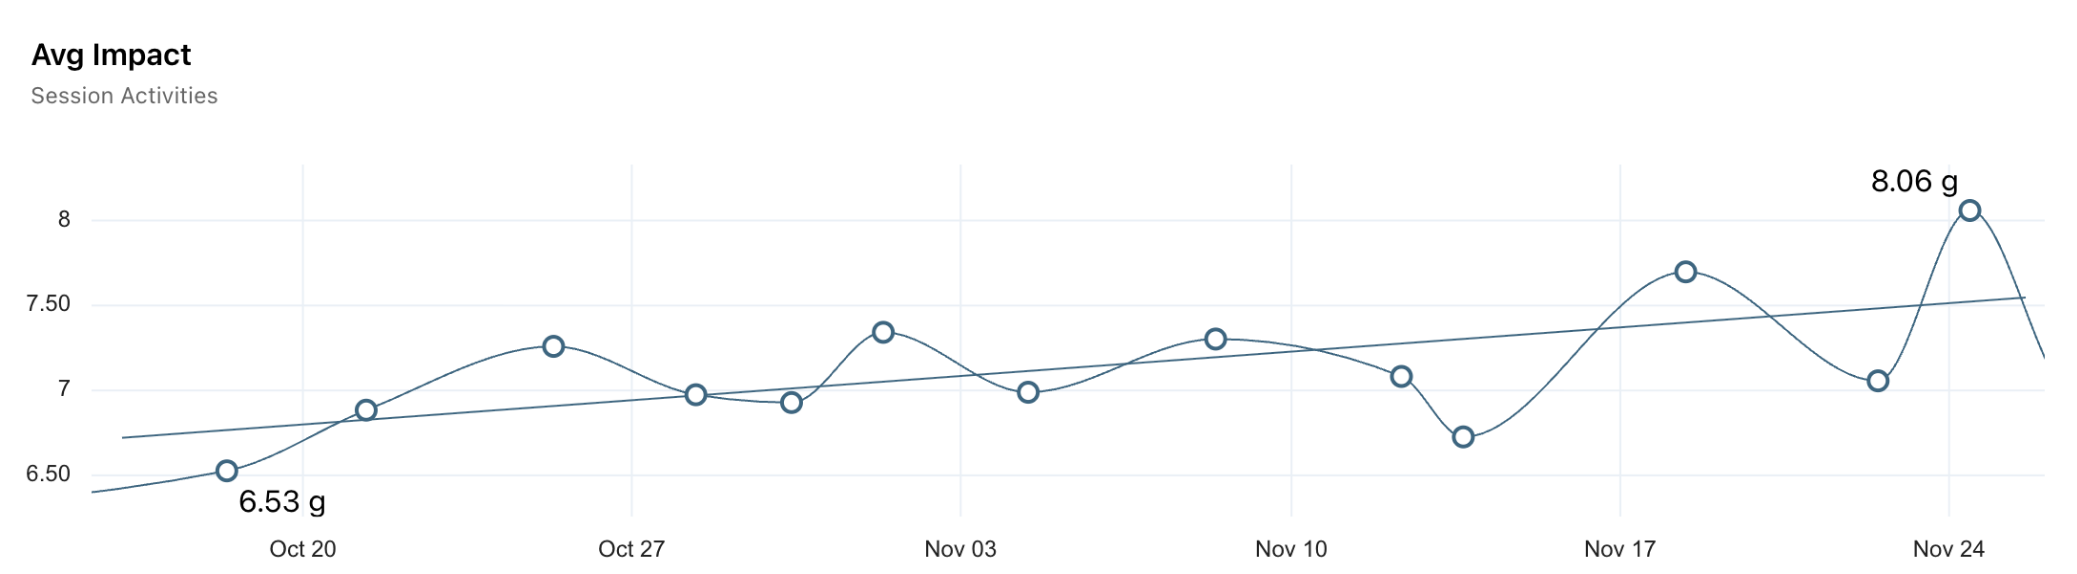
Increasing impact
The left and right values can illustrate where changes in asymmetry are coming from. For example, you can see in the Avg Impact Asym. graph below that the asymmetry is decreasing. When you look at each leg independently in the Avg Impact L/R graph, the right has stayed fairly constant, and the left has increased. This is important, because this athlete is rehabbing from an injury on the left and has been working on bringing up the capacity of the left side.
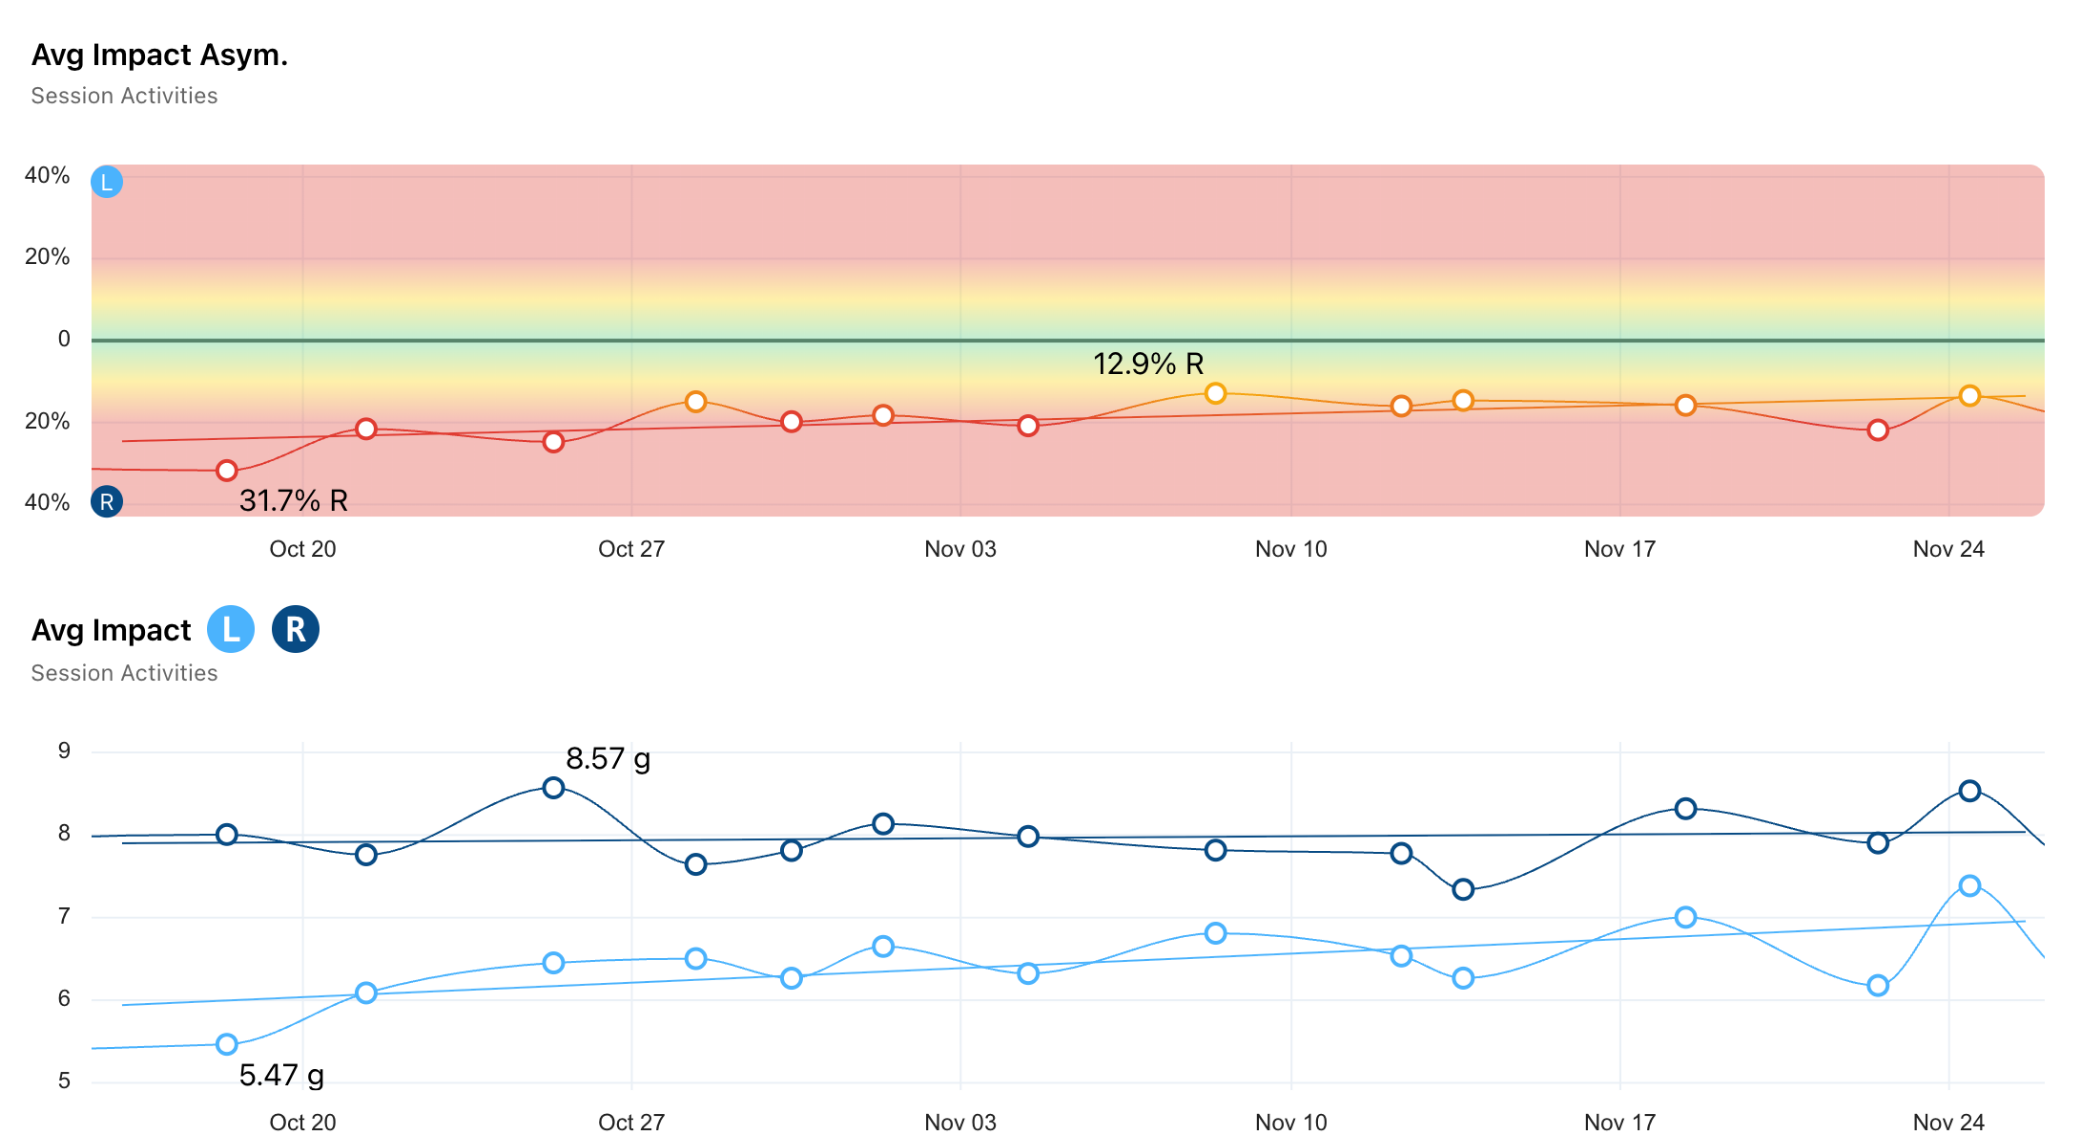
Decreasing impact asymmetry as a result of increasing left side impact
Impact Asymmetry
Impact Asymmetry is a measure of the difference in Impact Magnitude between feet, as defined by:
(R-L) / max(R,L)
Impact Asymmetry occurs when landing more abruptly on one limb compared to the other. This can mean either poor energy absorption on one side, or a protective strategy to offload one side. Knee injuries are often characterized by impact asymmetries. For example, a common progression after knee surgery is to have initially high asymmetry, favouring the unaffected side, as the person is offloading the injured side. Then the asymmetry will come down and actually cross over to show higher impact on the injured side, because they are using a stiff landing strategy to protect the knee.
Note: Asymmetries are individual to every person, so we recommend using a combination of the coloured bars and typical ranges to decide what is “normal” and what requires attention.
Vertical Impact
Vertical Impact is the component of Impact in the vertical direction. Note that this direction is relative to the world, not relative to the foot, so it is always parallel to the direction of gravity. It’s useful for characterizing the