
Plantiga 2.38
This is our biggest update of the year, and our team couldn’t be more stoked. We are launching new hardware that’s more powerful, more capable, and smaller, along with a series of major software updates that bring greater context to the data.
Arc5PRO
Introducing the arc5PRO, with a smaller form factor and a more powerful sensor. Everything is the same in this new hardware iteration, we’ve just decreased the size by 30% and doubled the sensor capability to capture higher accelerations.
A smaller sensor means:
improved comfort
fits into most cleat insoles
more easily embedded into orthotics
A 32g sensor means:
every explosive movement captured without saturation at 16g
better designed for elite athletes
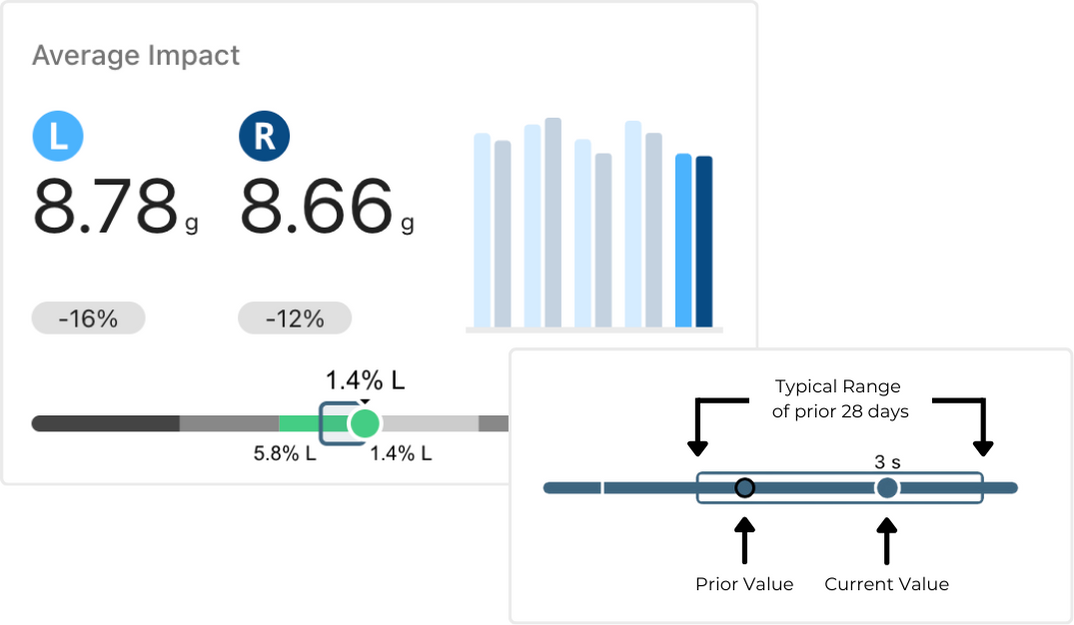
Let’s Get Personal - Individualized Ranges
Context is everything, and every athlete is unique. You can now view an athlete’s “typical range” over the last 28 days to see if they are above, below, or within their norm.
How are typical ranges used? Track your players and make subtle adjustments to their training to ensure that they don’t get hurt and that they don’t miss games. However, if they do, efficiently track their progress to make sure they get back on time.
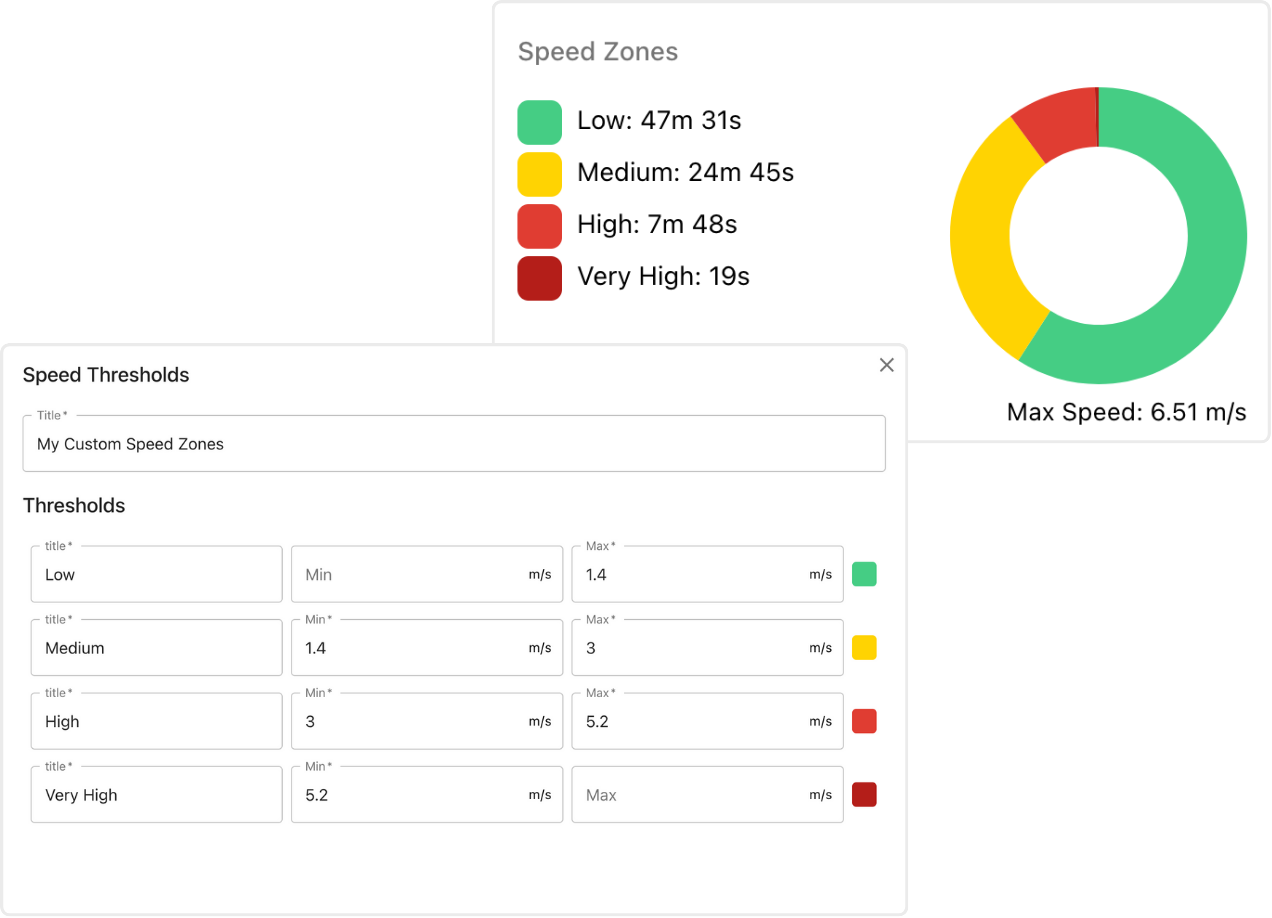
Custom Speed Zones
We’ve added the ability to customize the thresholds for the speed zones. This is important because we know that there is a ton of variability between men, women, different sports, and different abilities. Tune your zones from the “Settings > Preferences” page on plantiga.io.
Auto-Record
Never miss a session again. We’ve built the Auto Record feature to automatically create an activity type of your choosing when you upload data.
Just undock your pods, train, and dock them again. Everything else is auto-magic.
To enable Auto Record, go to “Settings > Activity Types” and select an activity type from “Auto Record Activity Type”.
Command Centers
We built a line of cases that we call Command Centers. They are easily connected to facility networks, can go on the road, and can be built to hold varying numbers of sensors, docks, and insoles.

Improvements - Small and Big
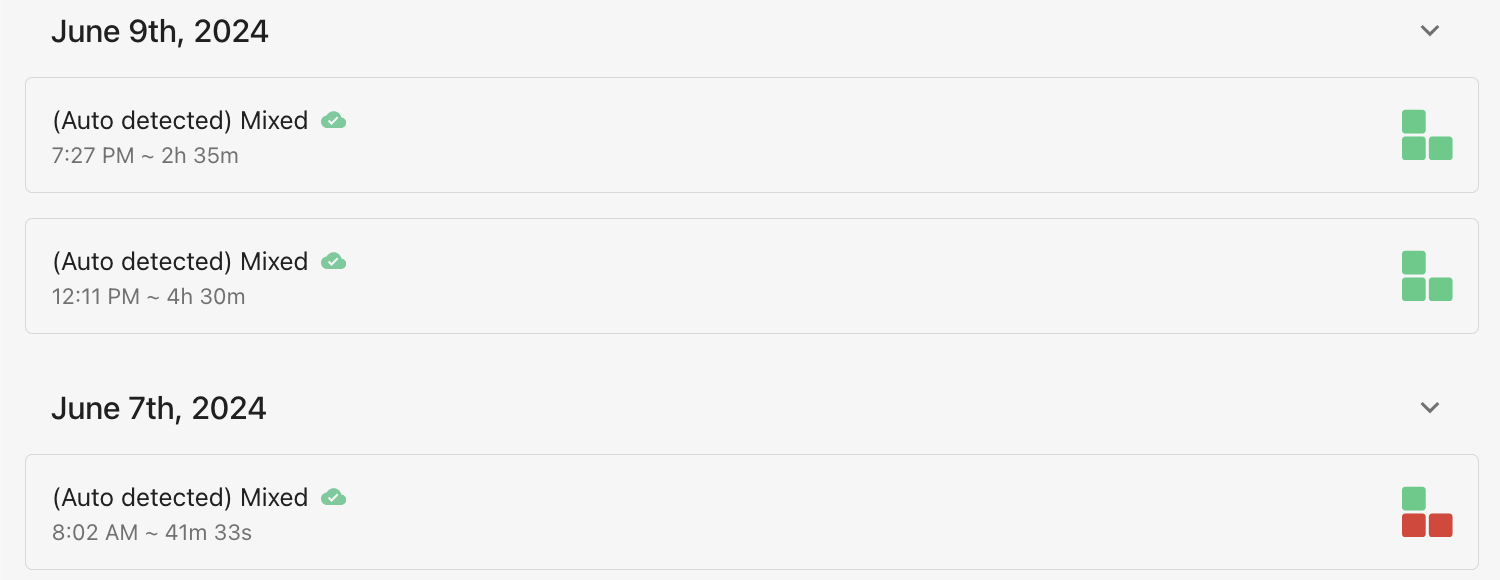
Asymmetry Quadrants
The Asymmetry Quadrants provide a quick visual check to see whether Athlete Load, Push-off, Impact, and Ground Contact Time Asymmetries are within normal ranges.
Use the Asymmetry Quadrants while scanning through the activity feed to identify changes in movement patterns, which may indicate things like injury and fatigue.
Mobile User Experience
trend plots are now responsive to touch input
overlapping x-axis labels on trend plots have been fixed
trend plots are full-width on mobile for better interaction and visualization
explore page signal plot is now responsive to touch input
Athlete Dashboard
select any of the following metrics to view over the last 28 days: Total Athlete Load, Athlete Load Intensity, Maximum Speed, Athlete Load Asymmetry, Push-off Asymmetry, Impact Asymmetry
history plot now supports viewing the previous values and dates on touch or hover
As always, any feedback or ideas are welcome.
Cheers,
Quin and the Plantiga Team