
Plantiga 2.39
We have 5 big changes in our latest release, including the much requested Distance Covered feature!
Distance Covered
After 6 months of algorithm development and validation, we now can accurately measure the distance covered from any on-court, on-field, and on-track session.
Measuring distance covered, and more specifically, distance covered in different speed bands, is critical in understanding how an athlete is performing. Add to that the ability to measure the biomechanical asymmetries in each speed band, and now we get a full picture of movement in the real-world. This enables better insights about how athletes are adapting to training after injury.
As far as we know, we’re the only system that measures distance covered via accumulated stride length, instead of triangulating sensor location from network beacons/satellites above, like GPS or LPS systems. We take a bottom-up approach, which means we get accurate distance data in any environment (indoors, outdoors, underground, literally anywhere).
Our Distance Covered summary shows you how far you traveled in each speed zone. The speed zone thresholds are also customizable from “Settings” > “Preferences”.
Subjective Questions
Building subjective questions into the software has been another big ask from groups over the last year. To make well-informed decisions, context is key. Without that, it’s a guessing game. Plantiga does a great job of measuring how a human moves, but only the athlete knows how they felt. This context is what the training staff and coaches need to make good decisions on what to do with the athlete.
Now you, or the athletes you manage, can keep track with 3 subjective questions:
Body Scan: 1-10 (bad - good) - how did your body feel during the session?
Energy Level: 1-10 (low - high) - how was your energy level during the session?
RPE (Rate of Perceived Exertion): 1-10 (low effort - max effort) - how hard did the session feel?
These questions are answered from the “Record” page after finishing a session, or from the activity summary card. You can easily edit the responses from the summary card by clicking it.
The answers can be plotted on the trends page to see how they change over time, and how those changes relate to the movement data.
Simplified Software Views
Historically, we have reported a lot of data on our platform. Depending on how the system is being used, it can feel overwhelming to navigate through all of it. If you’re an athlete collecting on yourself, or a coach, trainer, sports scientist, or researcher working with an athlete, you need to interact with the platform in slightly different ways.
To address this, we have built three Site Modes for the Plantiga experience, to cater to the needs of different users. Now, you can focus on what matters to you by choosing one of three options:
These Modes are currently set to the type of software license you have.
You can set the Mode from the “Display” section in “Settings” > “Preferences”.
Improved Activity Recognition
A core feature of the system is its ability to automatically detect walks, runs, and jumps. We use machine learning and AI to do this, and it’s something we are always improving.
We just updated our Human Activity Recognition Model (HAR), and the results are impressive.
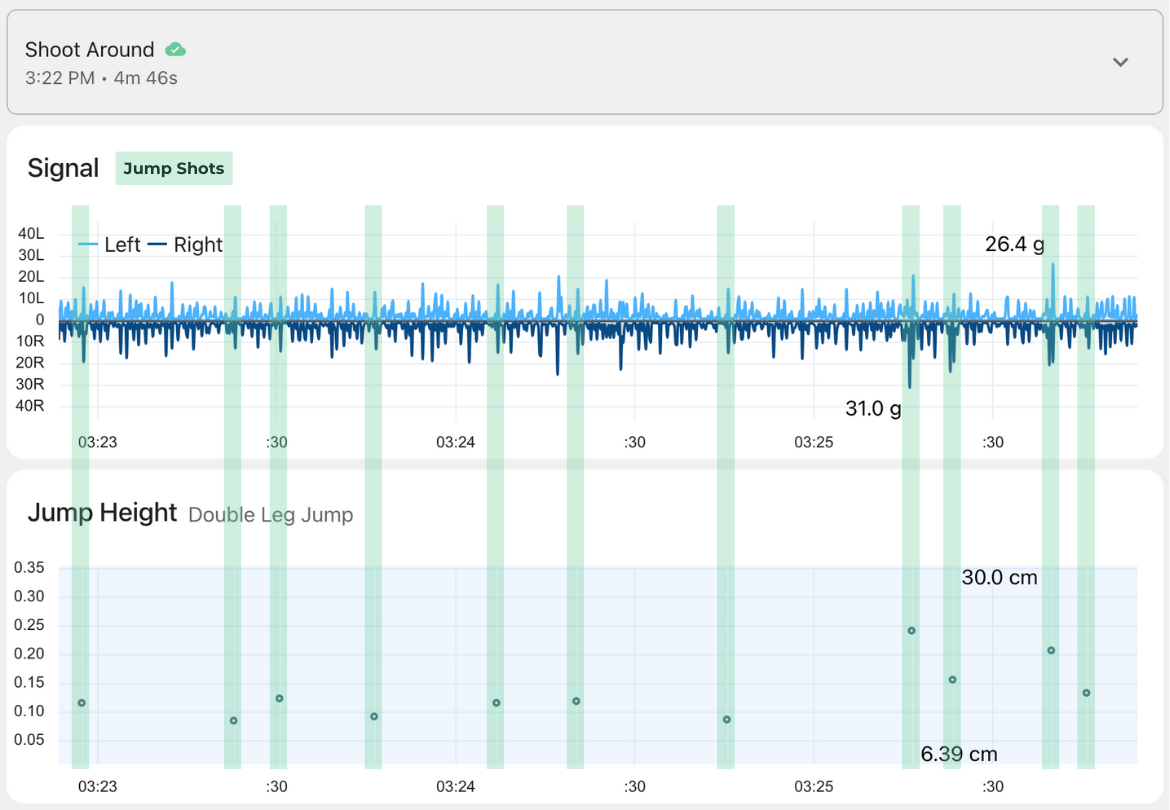
Specifically, single leg jumps and double leg jumps are detected with a much higher degree of accuracy, which in turn improves our walking and running metrics.
This will enable us to do some pretty exciting things in the future, in terms of counting and analyzing jumps (think jump shots in basketball or attacks in volleyball), but for now this means we are providing the most accurate metrics Plantiga has ever had to offer.
More new features!
Better Plot Interactions
TLDR Splits and masks have moved! Find them in the improved action menu now.
For the practitioners working with the in-session data, we have substantially improved the way you interact with the plots. Here are the main changes:
The tool-tip follows your cursor, so it no longer blocks the plot.
Dragging over a section of the plot creates a highlighted region, with an action menu.
Action Menu options:
Zoom in: click the zoom icon or hold shift while dragging to zoom.
+ SPLIT: create a split activity for the highlighted region
MASK: omit values outside of the highlighted region from the summaries
We hope you enjoy the updates and as always, we welcome any feedback you have for us. More coming soon!
Cheers,
Quin and the Plantiga Team