
Almost every rehab process follows the same arc. Force plates in the lab. Motion capture in the facility. A battery of tests, a set of benchmarks, a green light. And then the athlete walks back onto the field, the court, or the ice, and the monitoring simply ends.
That handoff is the biggest blind spot in sport science. Athletes return to play with no visibility into their biomechanics, movement asymmetries, or real-world loading strategies. If something goes wrong later (a reinjury, a regression, a plateau), it gets chalked up to biology, to the limits of the surgery, or to bad luck. In reality, exercise and load are both the poison and the medicine. Without precise visibility on the field of play, teams aren't managing risk. They're hoping for the best.
Two terms, and the difference between them
"Return to play" and "return to performance" get used almost interchangeably, but they mean very different things.
Precision Rehab
An approach to injury rehabilitation that uses objective, individualized data (biomechanics, movement quality, load metrics) to tailor and progress an athlete's recovery plan, instead of relying on generic timelines or protocols.
Return-to-Performance
The process and criteria for determining when an athlete hasn't just been cleared to participate again, but has actually regained the physical capacity and movement quality to perform at or above their pre-injury level.
That gap between cleared to play and ready to perform is arguably more important than the rehab that came before it. Careers are rebuilt or quietly lost in that phase, and it's the phase that almost nobody actually measures.
Why the data stops at the clinic door
Clinic and lab data is fantastic for early and mid-stage rehab. In the later stages, though, when the athlete steps into the real world, there are so many external factors influencing their movement that the structured assessments from the clinic are simply not representative of what they are actually doing.
The tool that most teams lean on to fill that gap is GPS or LPS tracking. However, while that’s better than nothing, it's worth remembering that GPS was originally built to track tanks and industrial equipment, not the granularity of human biomechanics. You get a rough sketch of speed and distance covered. You get no insight into movement quality, asymmetry, or how an athlete's mechanics are holding up under fatigue - the things that actually predict reinjury risk. If you were to set out today to build a system specifically for human performance, you wouldn't build what most teams currently use. You'd want real biomechanics married to real load, speed, acceleration, deceleration, and direction change, quantified step by step, in the environments that actually matter.
What that gap costs: Gabe's story
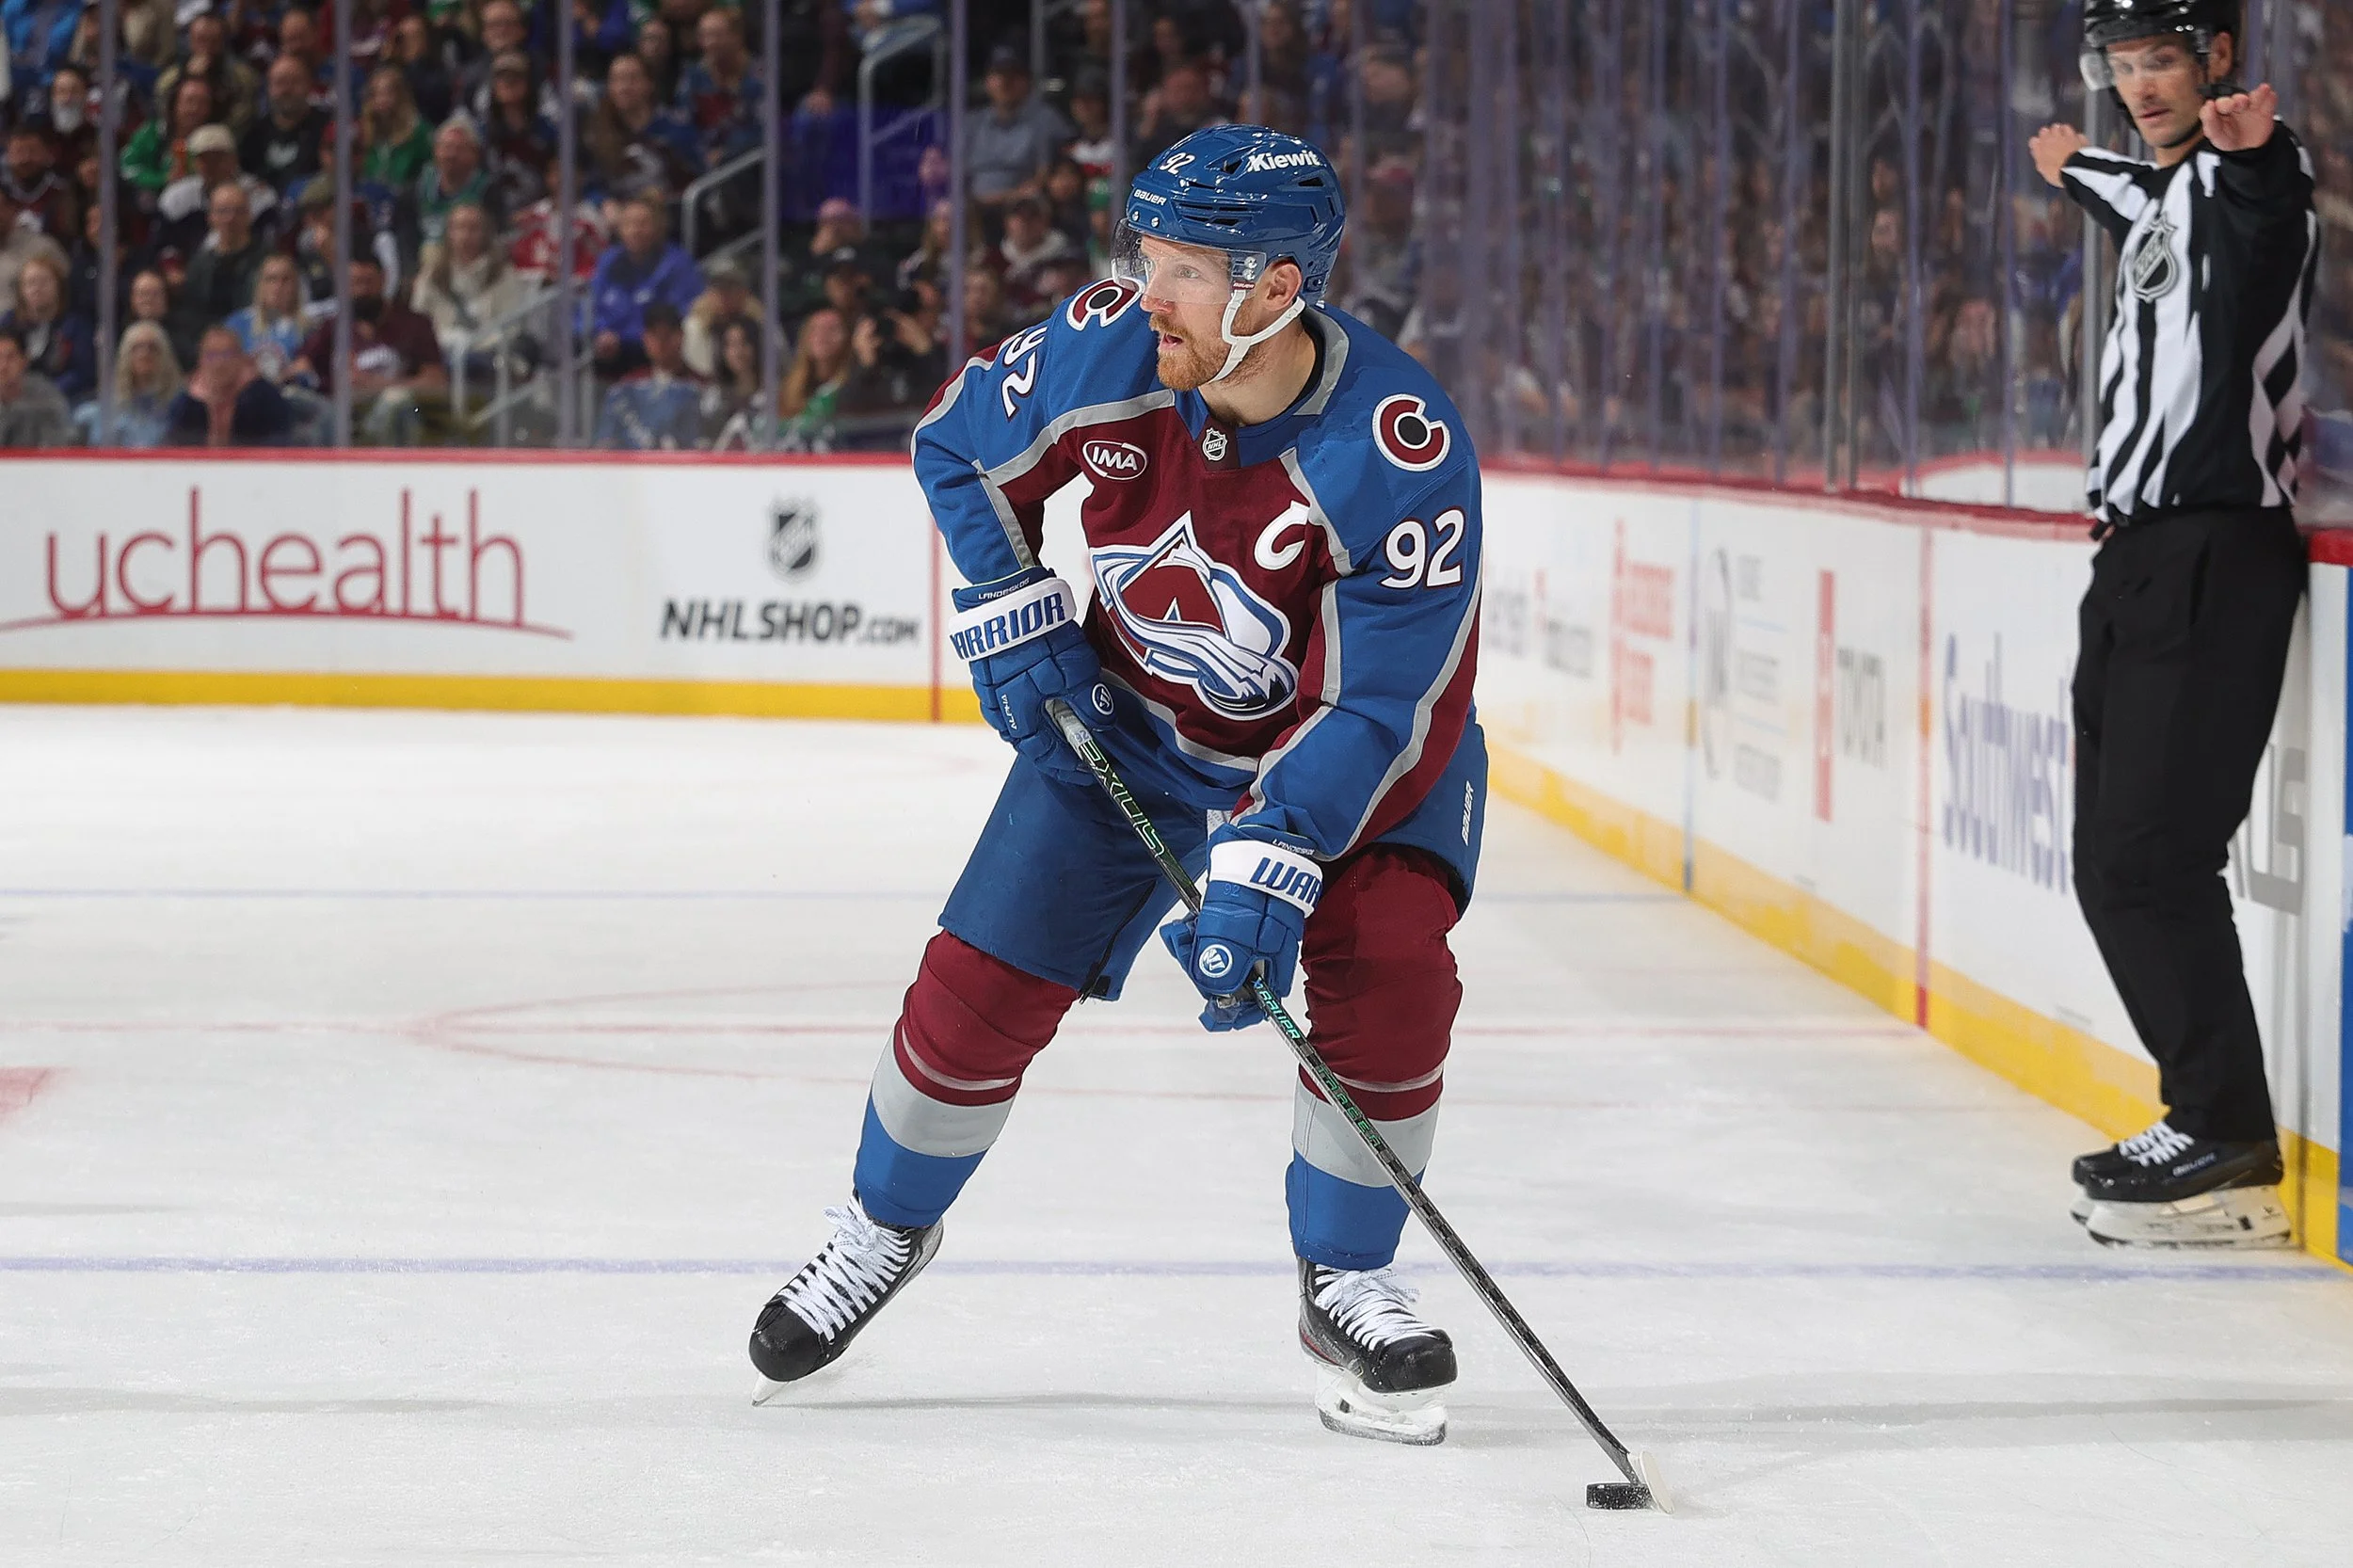
Gabe Landeskog's return to play after a severe cartilage injury was more than 3 years of a cyclic pattern that ends so many comeback stories: skate a little, flare up, setback, frustration, repeat. Every cycle risks more damage, and athletes stuck in that loop often end up managing through pain medication, compensating around the problem, or retiring early.
What changed the trajectory wasn't more rest or more caution. It was visibility: precise, stride-by-stride data on how Gabe was actually moving and loading on the ice, so decisions could be made on evidence instead of guesswork. By many accounts, Gabe is now playing some of the best hockey of his career.
Closing the gap: monitoring loads, biomechanics, and asymmetries on the field
An athlete might look nearly symmetrical walking around the training room and show a significant asymmetry once they're sprinting or cutting under fatigue in a game. Asymmetries measured in a constrained lab setting aren't representative of movement patterns in the chaotic, unscripted environment of live play, and that gap is where reinjury risk actually lives.
Tracking how asymmetry evolves as intensity rises also tells you where to intervene. Impact asymmetry that shows up in deceleration points toward a deficit in eccentric capacity and patterning. Push-off asymmetry in sprinting points toward concentric capacity and leg stiffness. Ground contact time asymmetry at walking pace points toward fatigued offloading patterns. Different deficits call for different fixes, and none of them are visible from a GPS dashboard.
The bottom line
Precision rehab and return-to-performance don't live in the clinic. They live on the field, the court, and the ice. Every step, every session, every game is a data point, and teams that keep measuring through that final, highest-risk phase of rehab are the ones who send athletes back not just cleared, but stronger and more resilient than they were before they got injured.