
The pilot problem
In the late 1940s, US Air Force pilots were losing control of their planes. The cockpits had been built in 1926 around the average pilot's body, so the Air Force assumed pilots had grown and the average needed updating.
One lieutenant, Gilbert Daniels, asked a different question: how many pilots were actually average? He took data from 4,063 pilots and discovered that even with "average" defined generously, as the middle 30%, the answer was zero.
The Air Force didn't need a better average, it needed equipment that adjusted to each pilot. Once this was understood and implemented, performance improved.
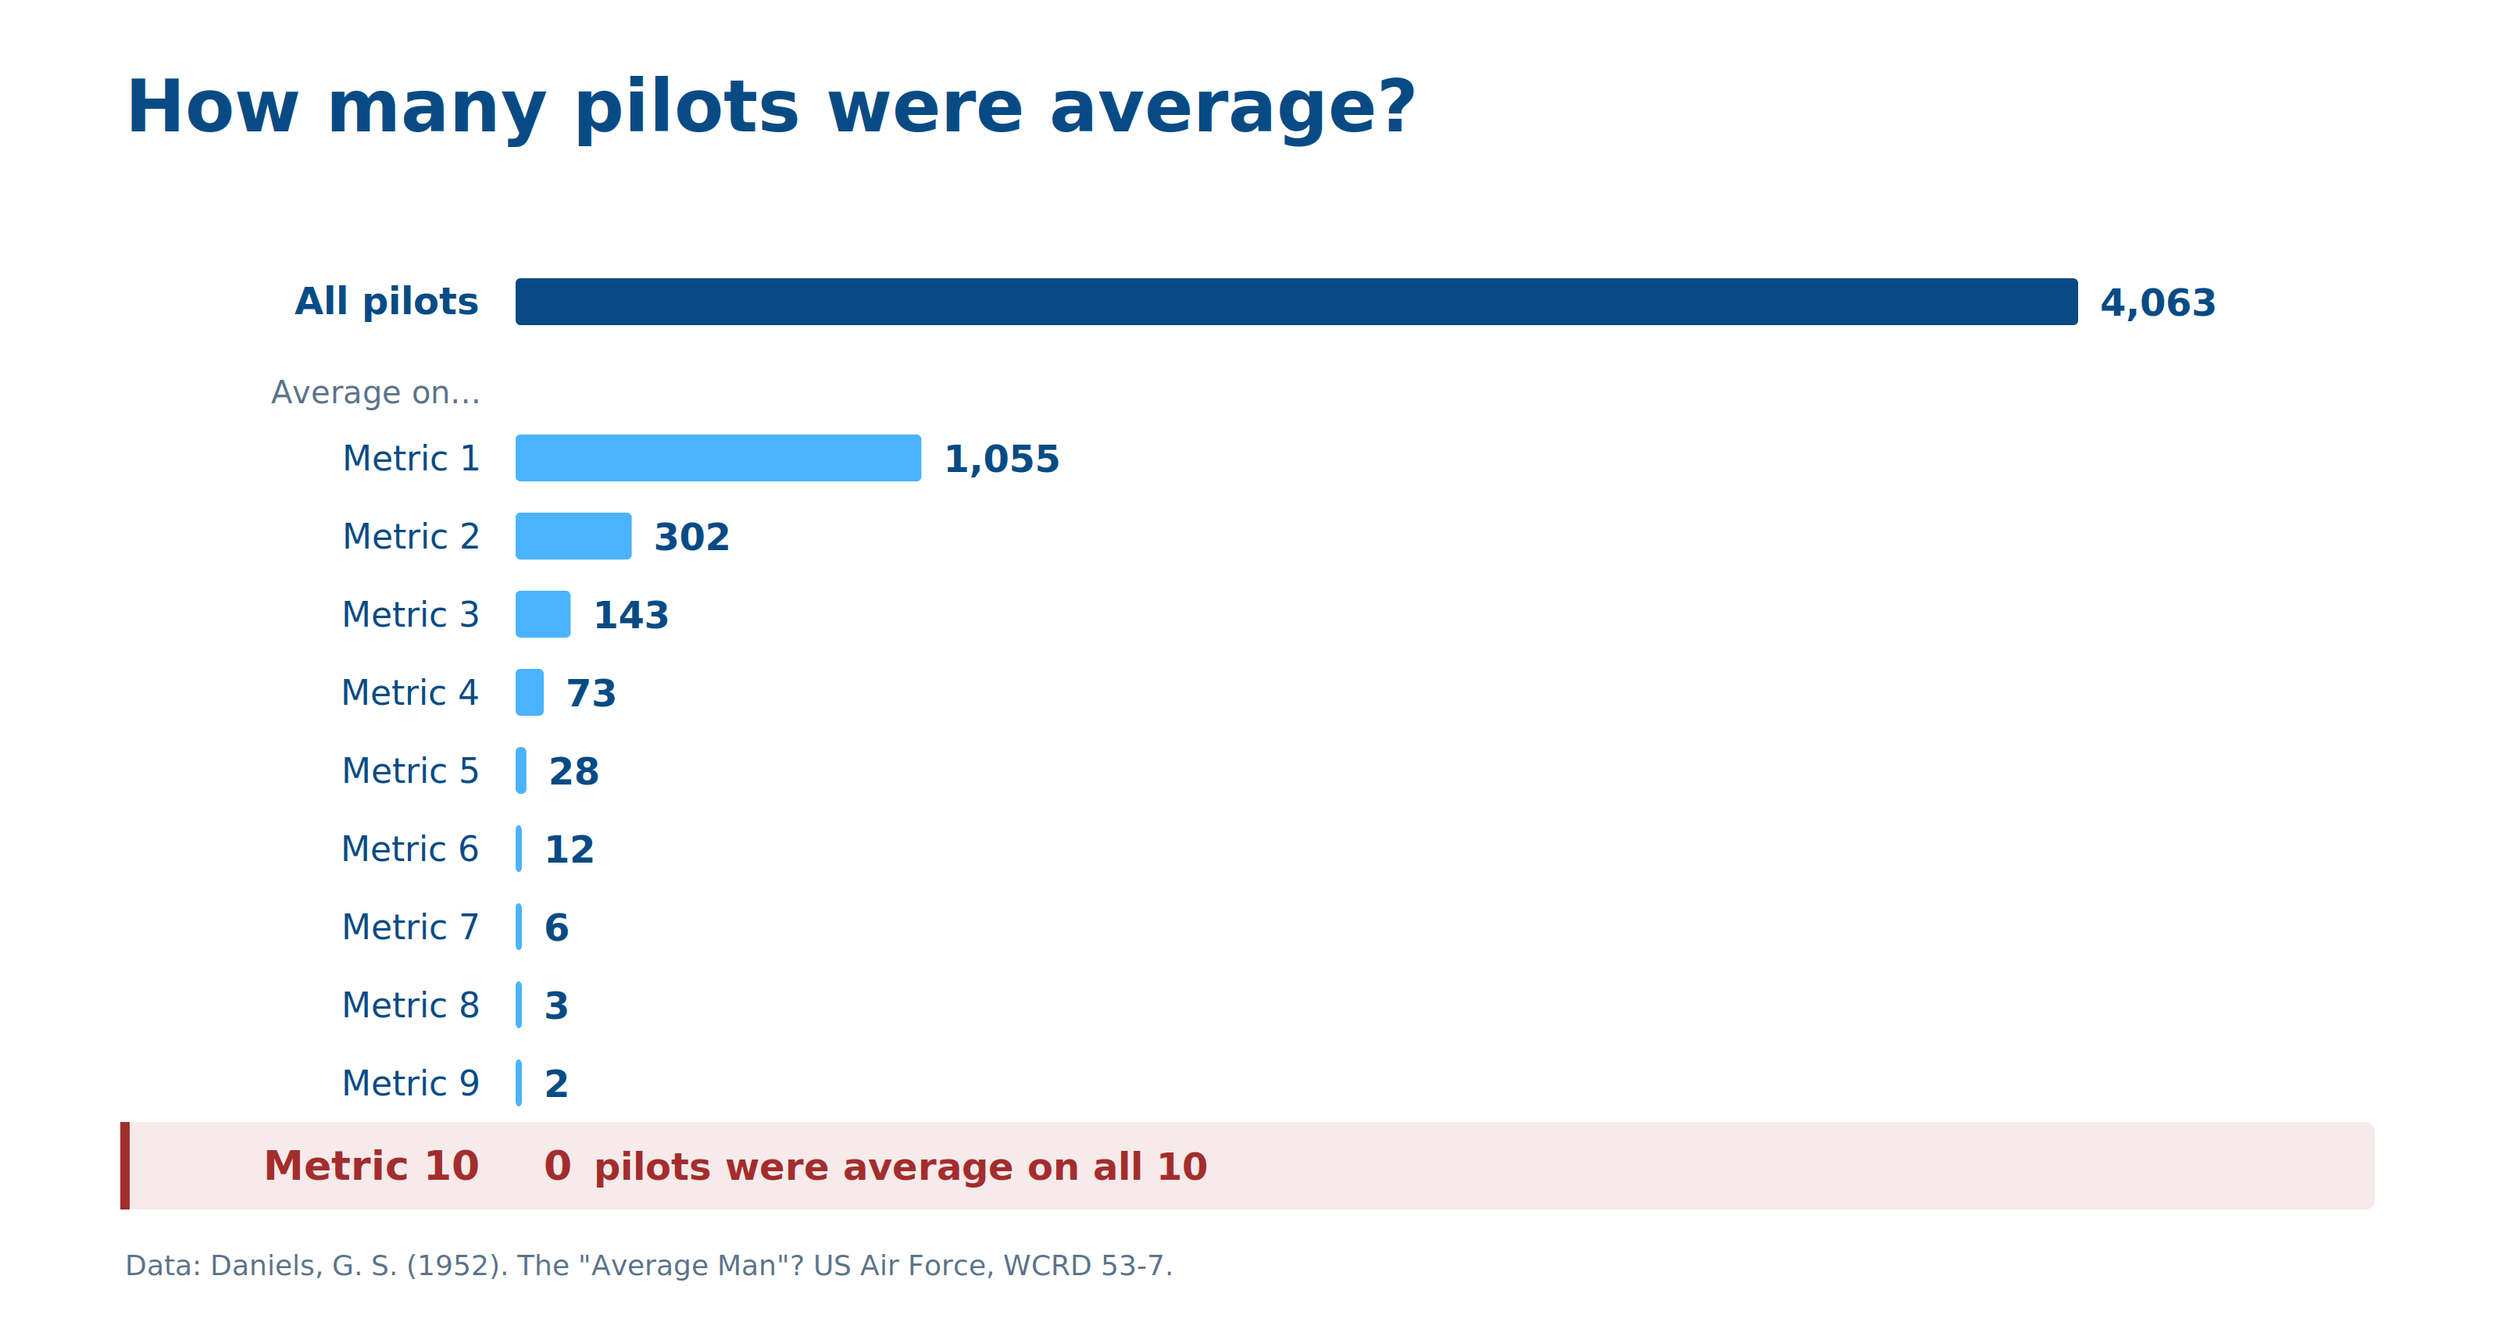
Sport science still designs for "the average pilot", comparing athletes to norms and thresholds built around a person who doesn't exist.
Why averages describe no one
The more variables you measure, the less likely anyone is to be average on all of them. Being near the middle on one measure is common. Being near the middle on multiple is close to impossible. Movement is built from dozens of interacting variables, so the "average athlete" is a statistical artifact.
Averages also break down when the data isn't a neat bell curve. Imagine a team where half the players are explosive, short-contact athletes and half are long, elastic movers. Average them together and you get a profile that matches neither group, and no player on the roster.
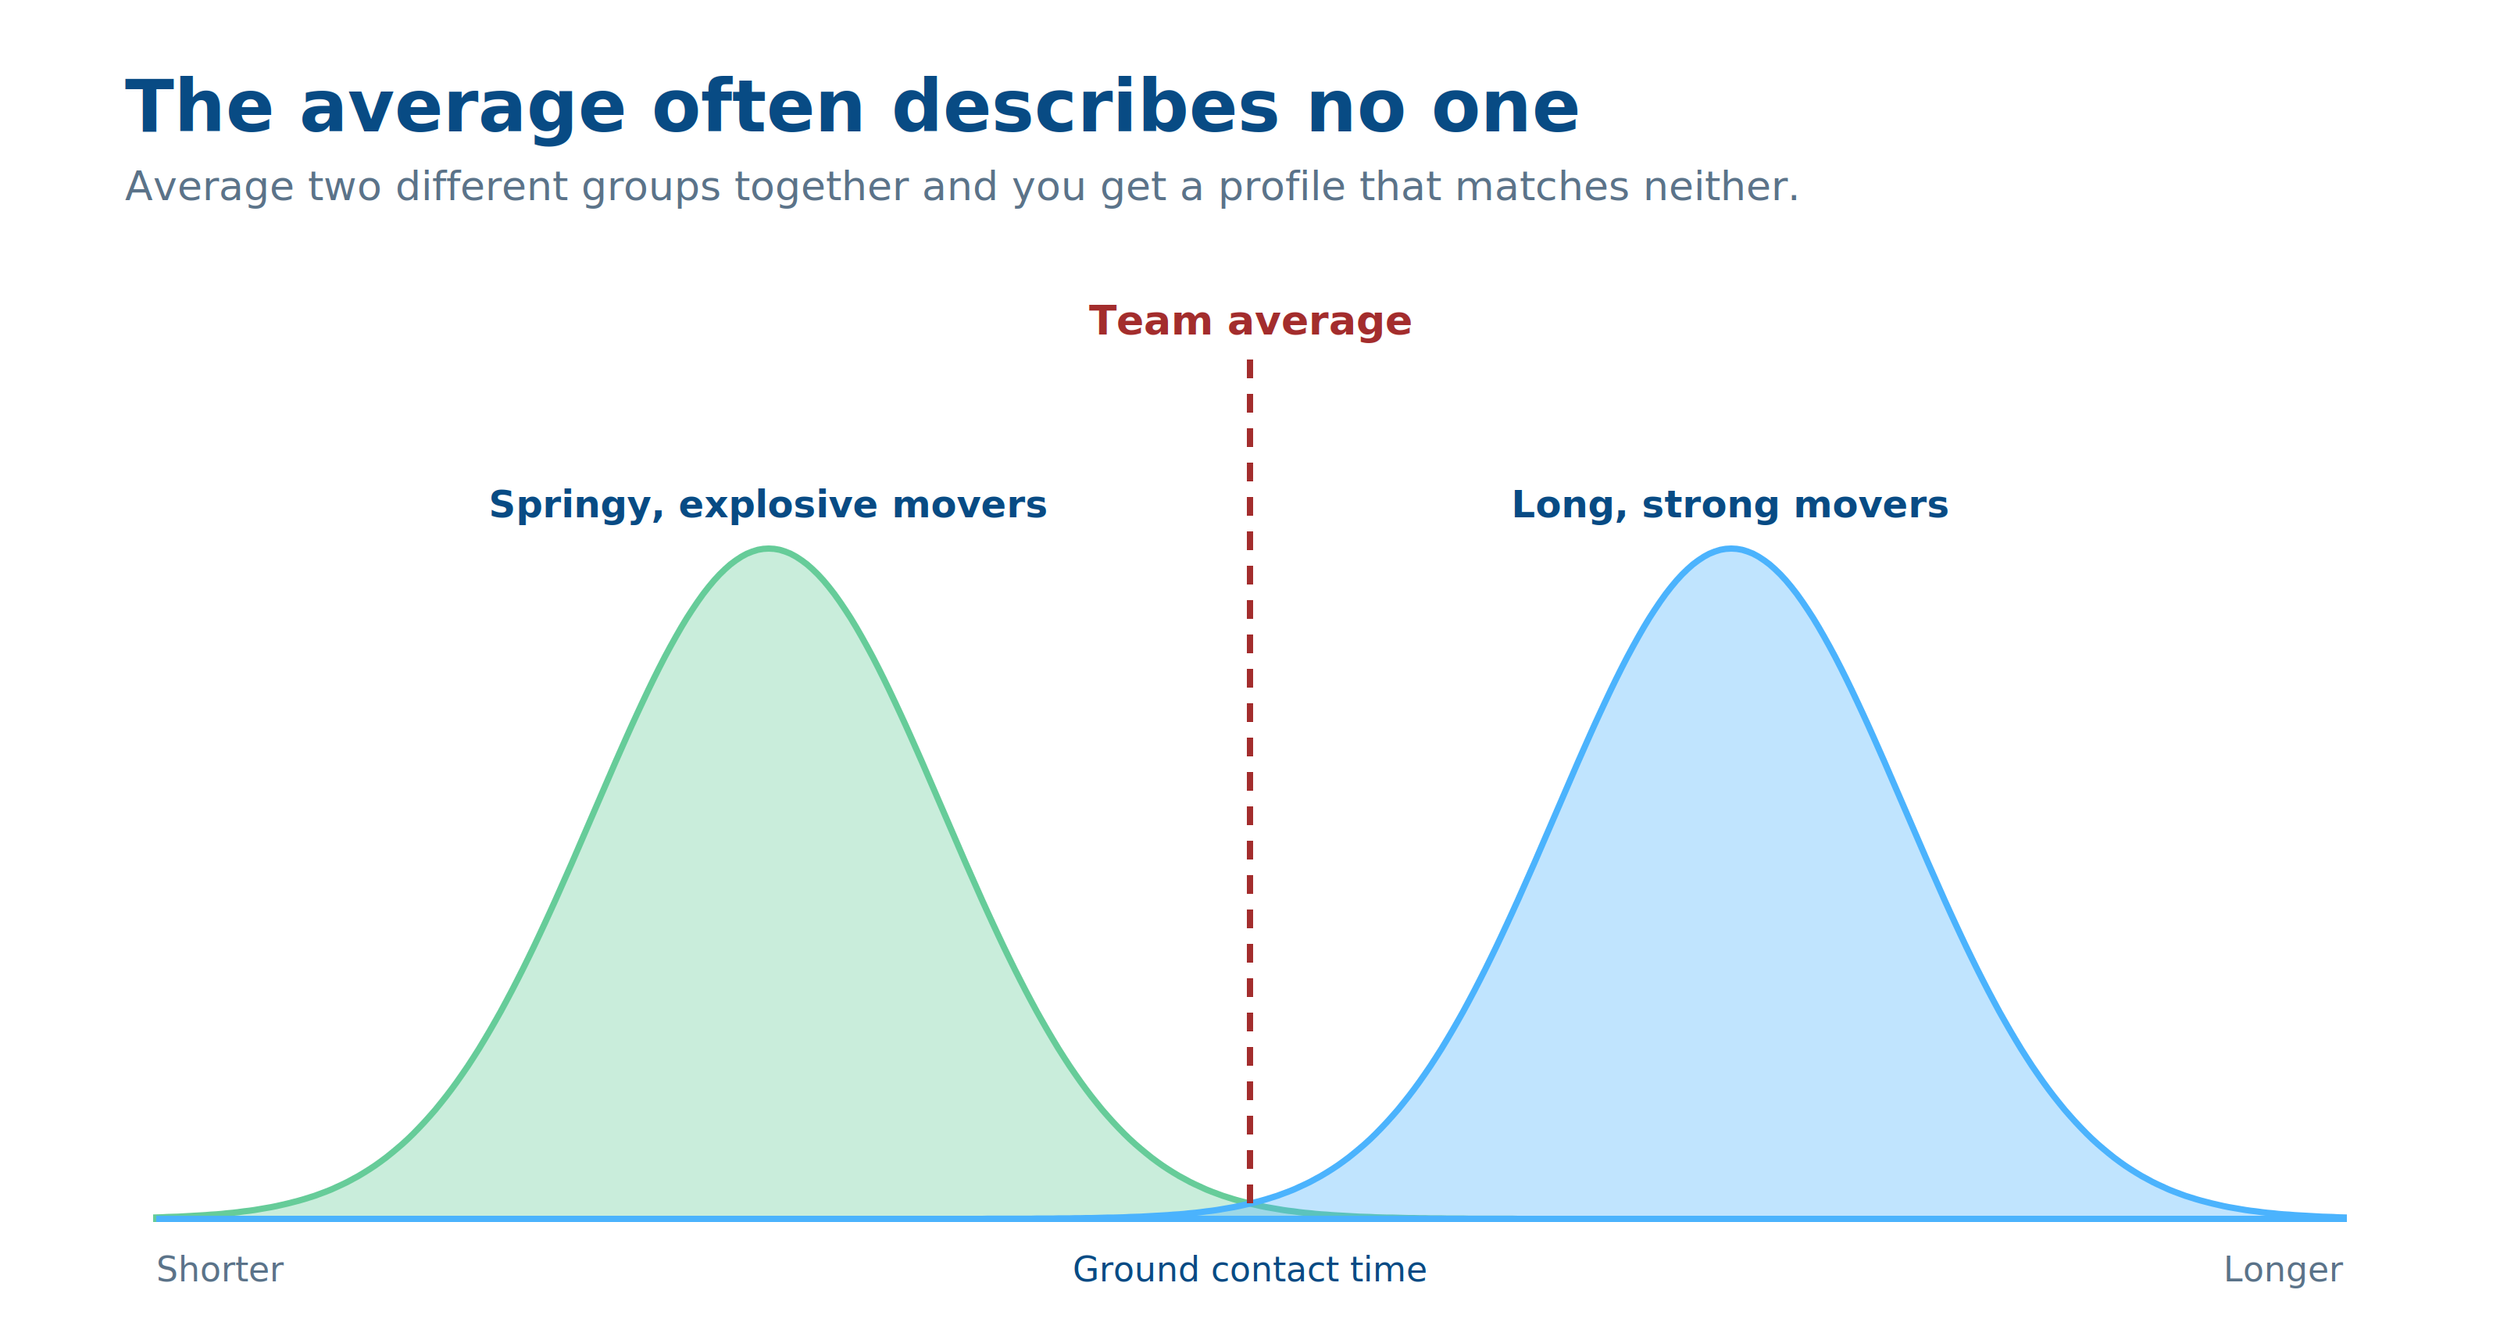
An average is a summary of a group. It was never meant to describe a person in it.
Where sport science still leans on averages
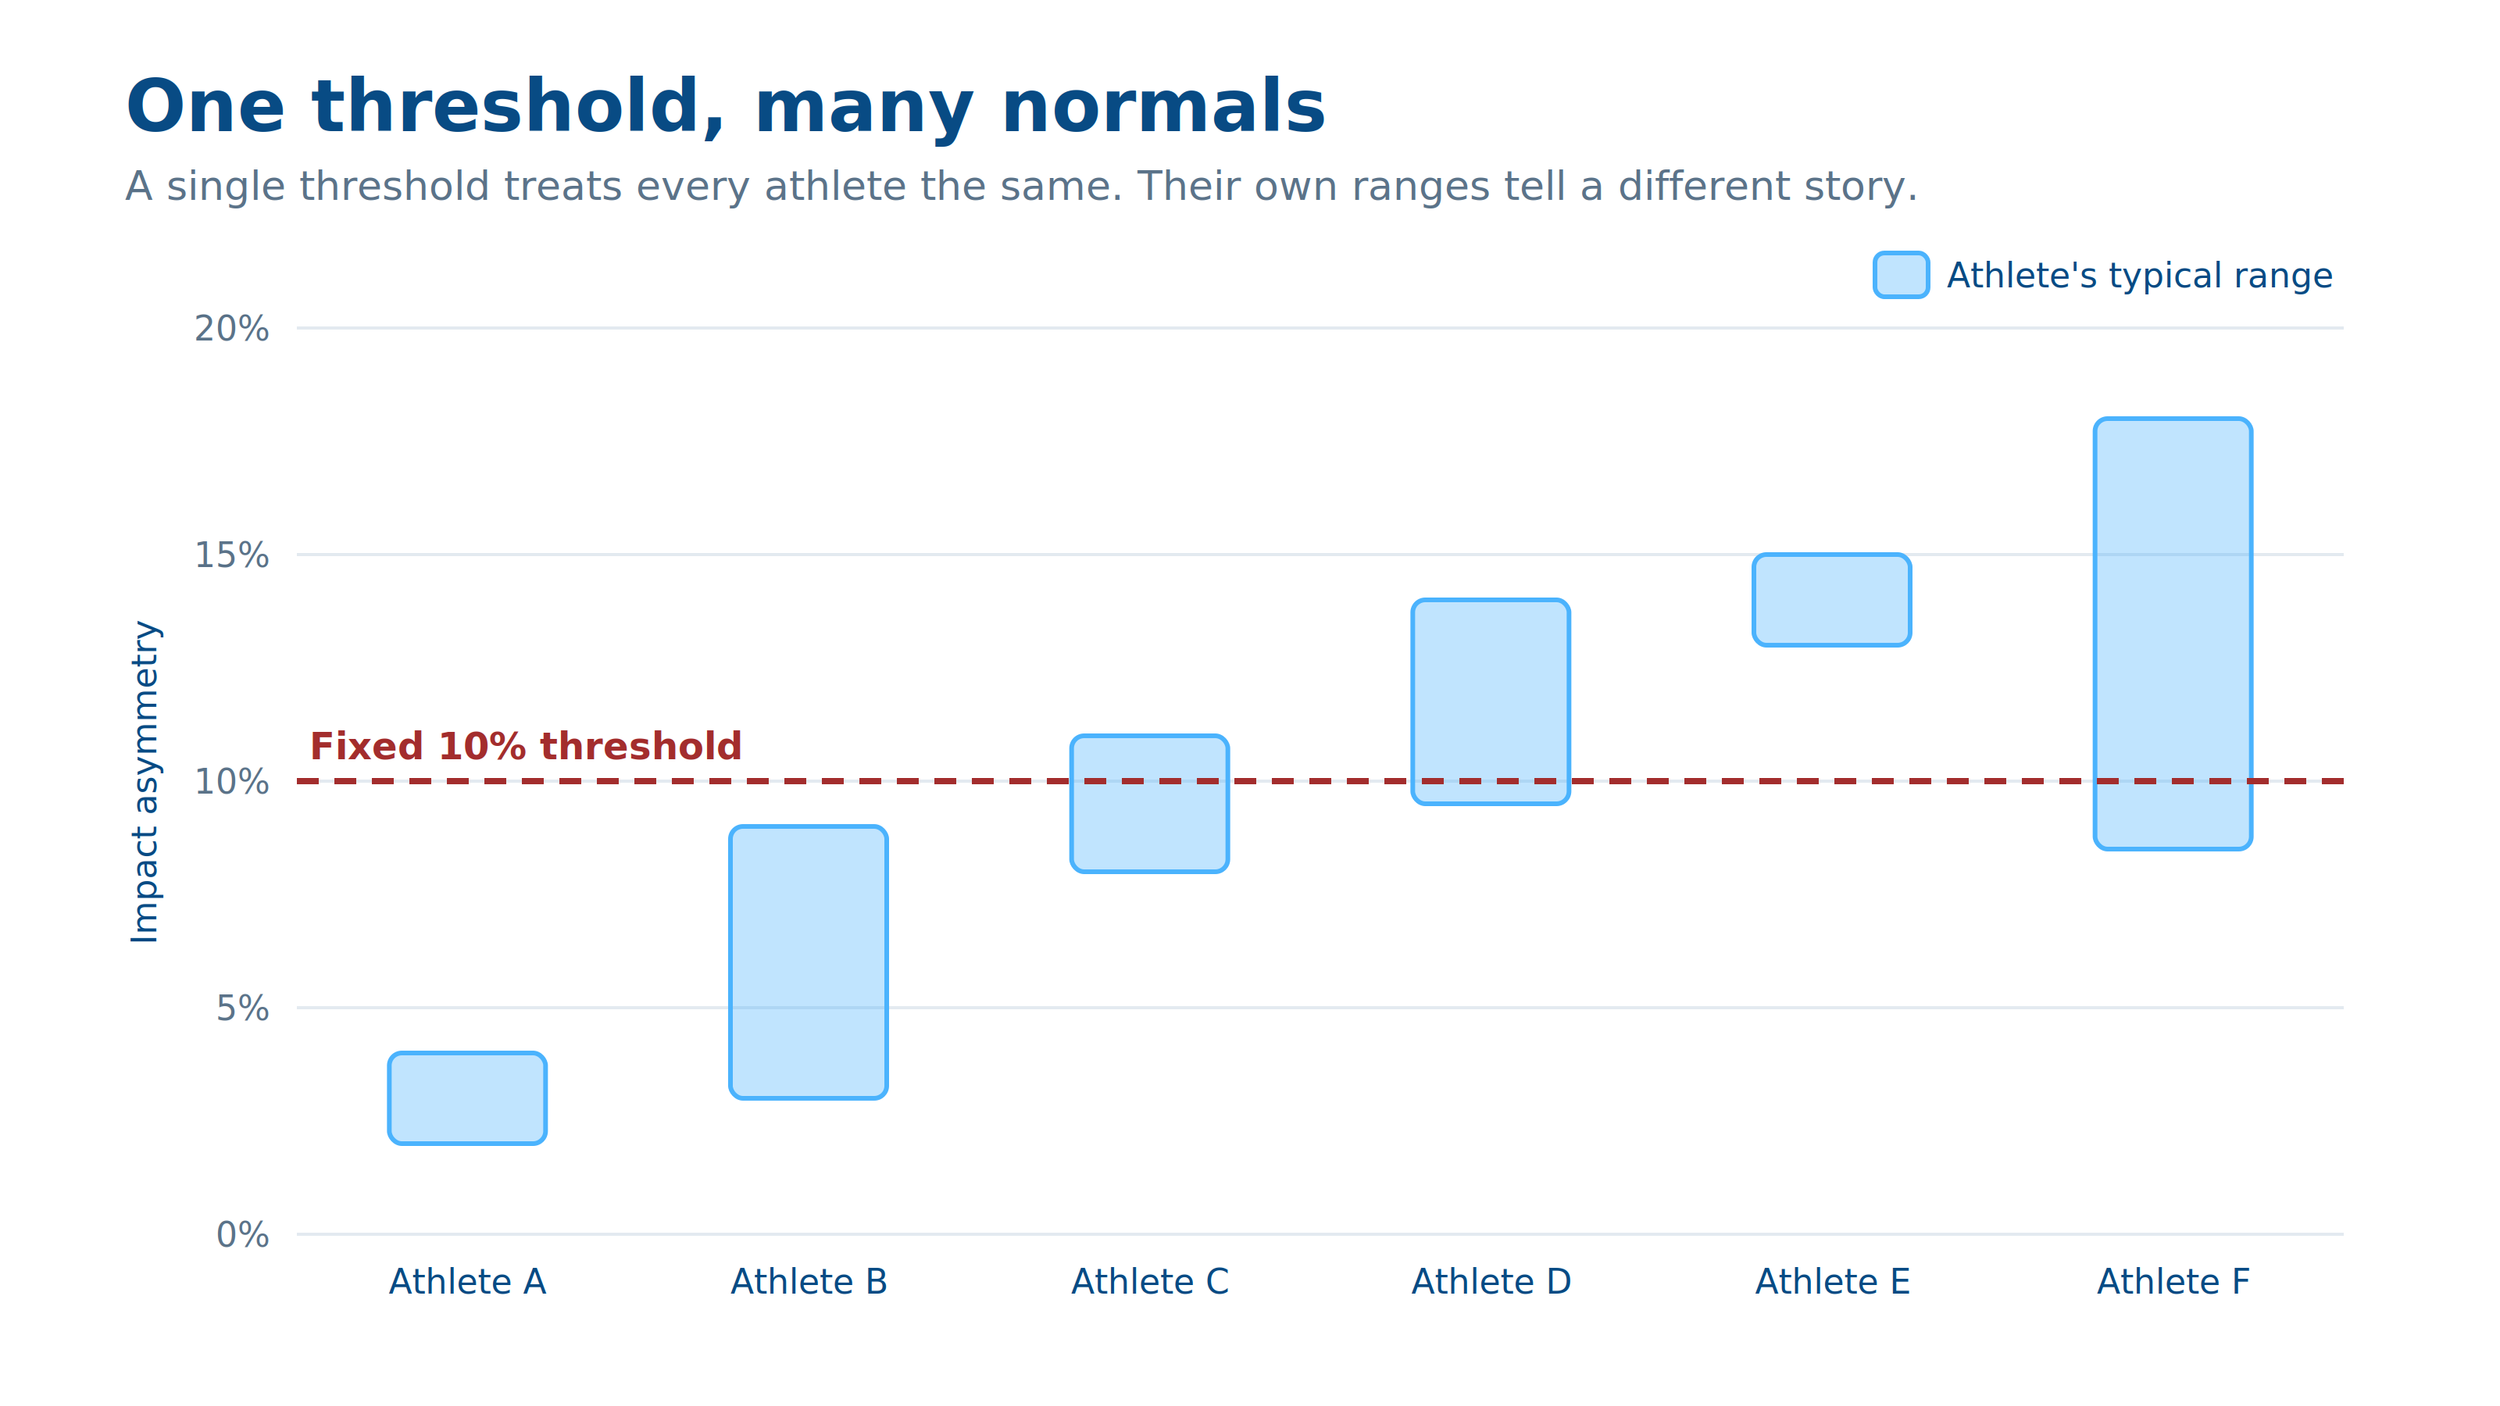
Fixed asymmetry cutoffs. Return-to-play decisions often hinge on a single number, such as asymmetry under 10%. That cutoff assumes every athlete starts from perfect symmetry. Many don't.
Mismatched normative data. Reference values are often drawn from populations that differ from the athletes being assessed in sex, age, sport, or competitive level. A youth soccer player compared against adult norms, or an elite sprinter against recreational runners, is being measured against the wrong group.
Women measured against men. Much of the foundational research in sport science was conducted on men. When women are assessed against norms built mostly from men, they're being compared to an average from a different population entirely.
What averages are useful for
Averages aren't useless. They're a starting point.
Anchoring. They give a rough sense of where values typically land, which helps when interpreting a new metric or a new athlete.
Flagging outliers. A value far outside the typical range is worth a closer look, even if it turns out to be normal for that athlete.
Screening without history. When you have no prior data on an athlete, population values are the only reference available.
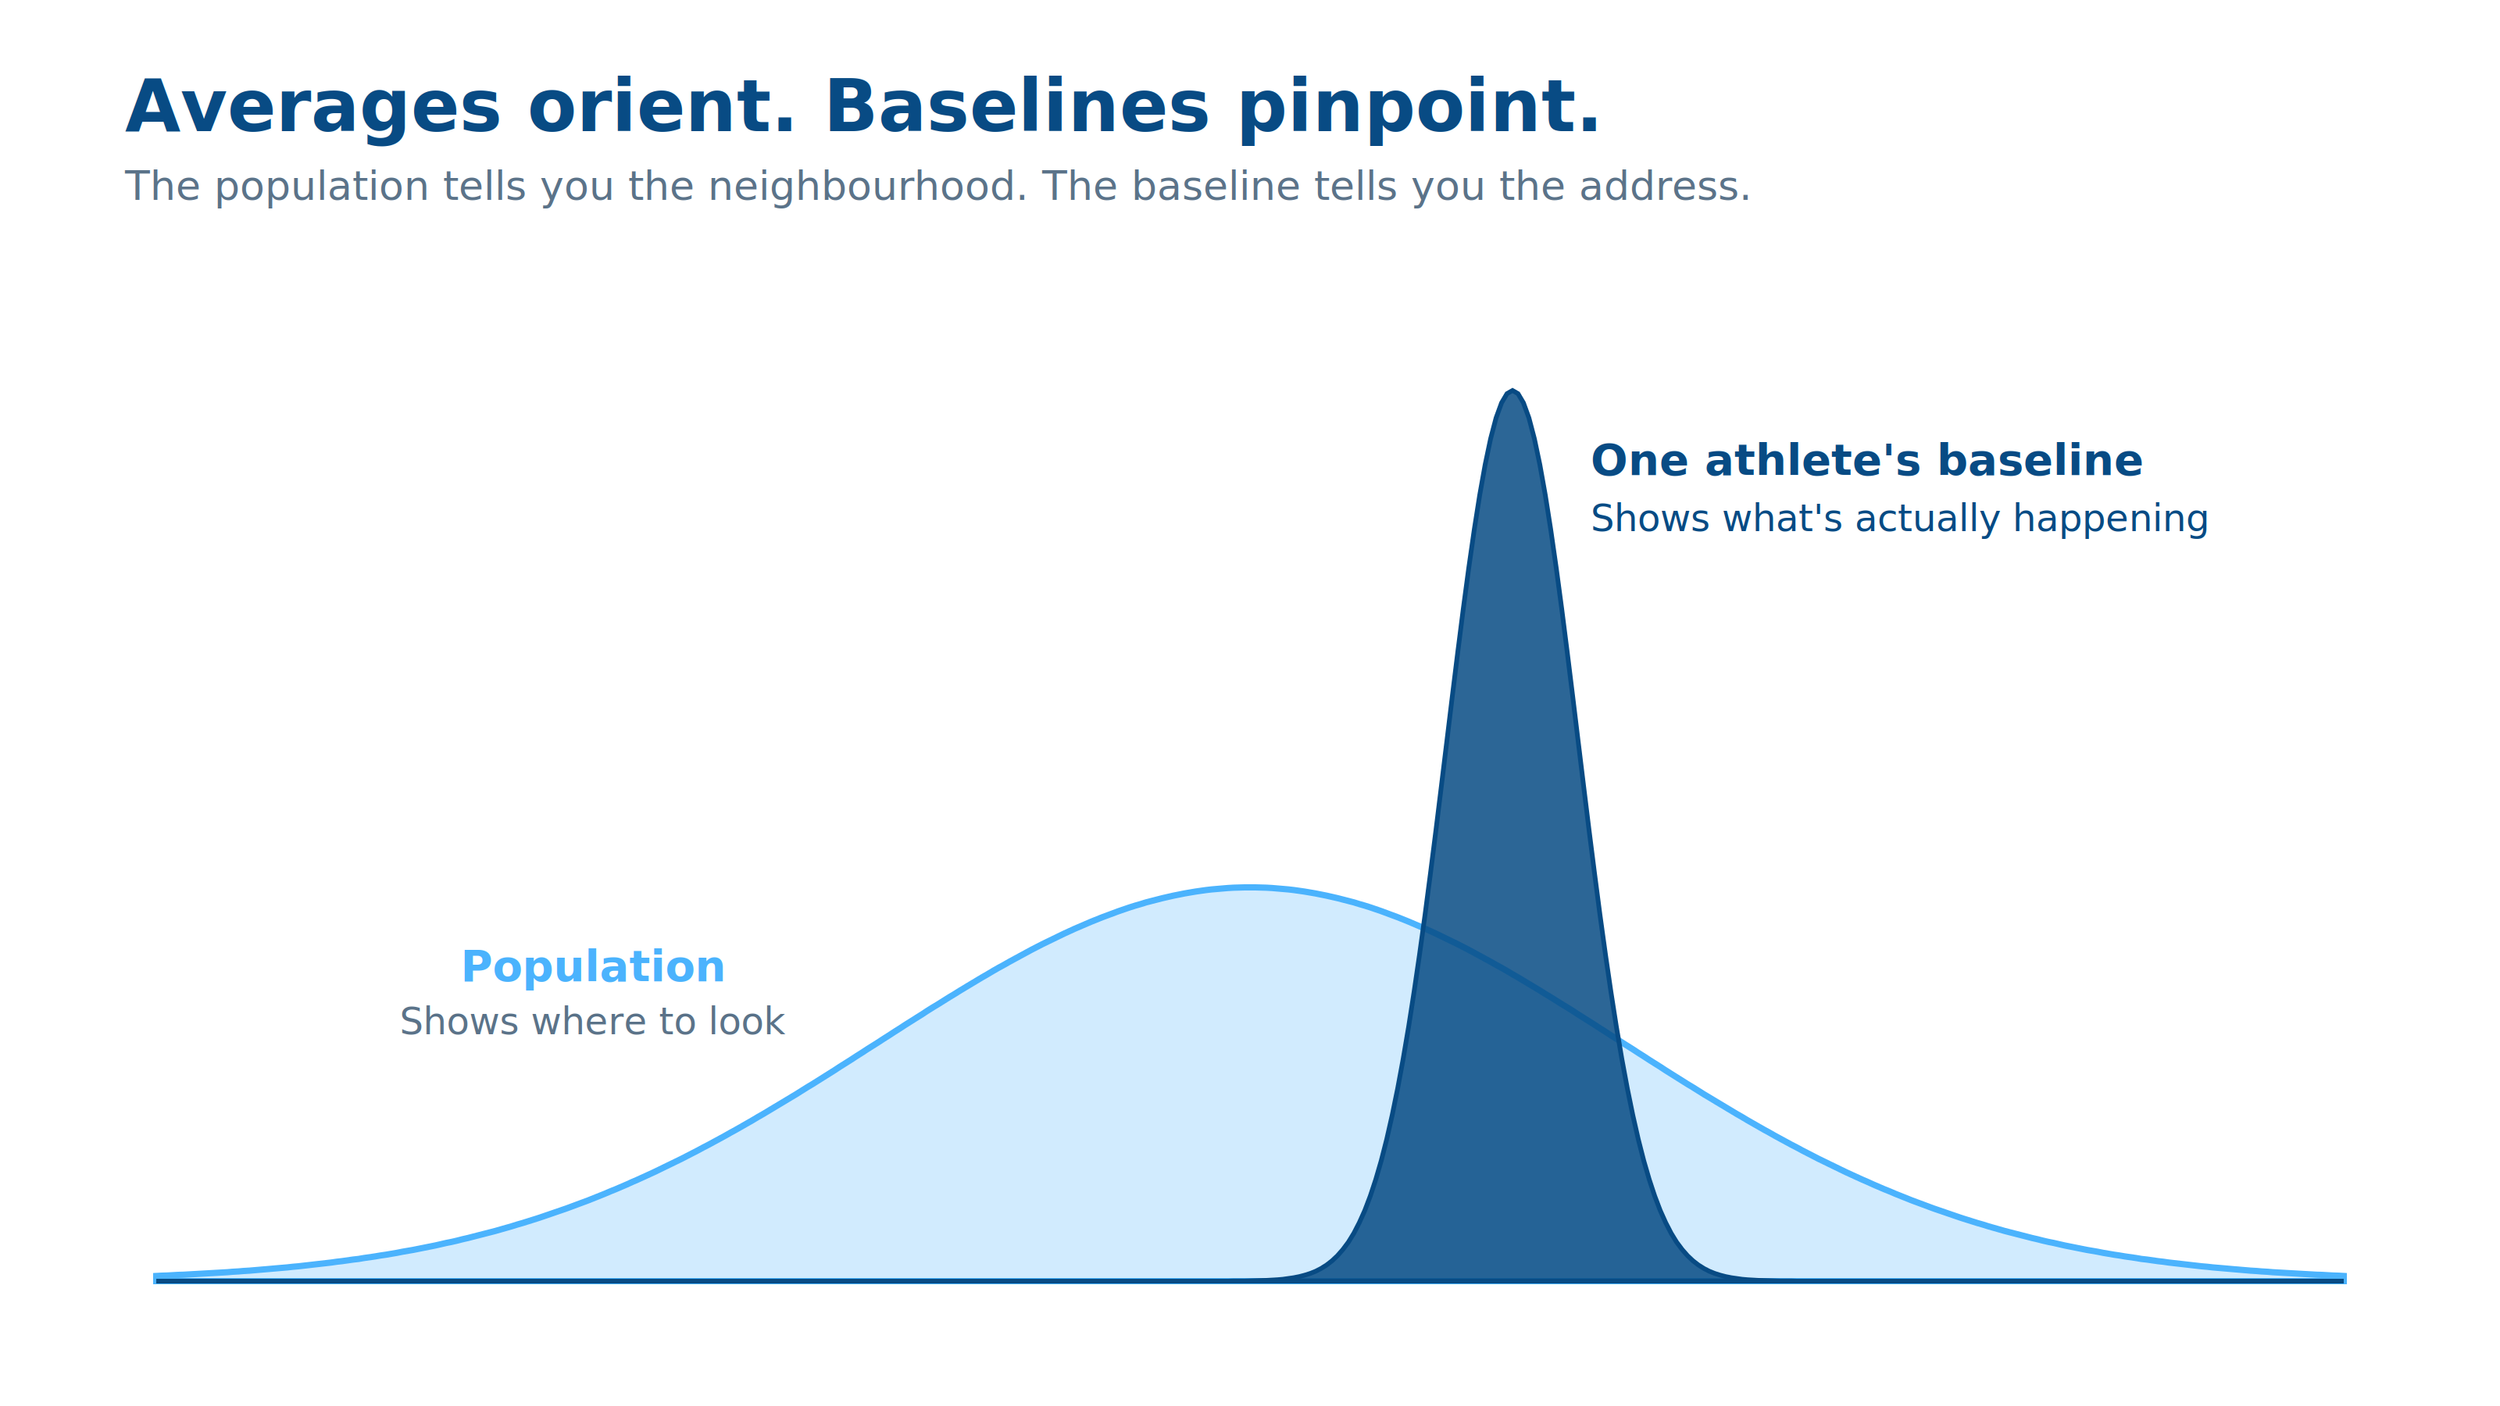
The problem isn't using averages. It's treating them as a verdict instead of a first guess.
The individual baseline
Some athletes are asymmetrical by nature. A soccer player who strikes with one leg, a high jumper who always takes off from the same foot, a pitcher who lands on the same side thousands of times a season: their bodies adapt to their sport. Asymmetry is their normal.
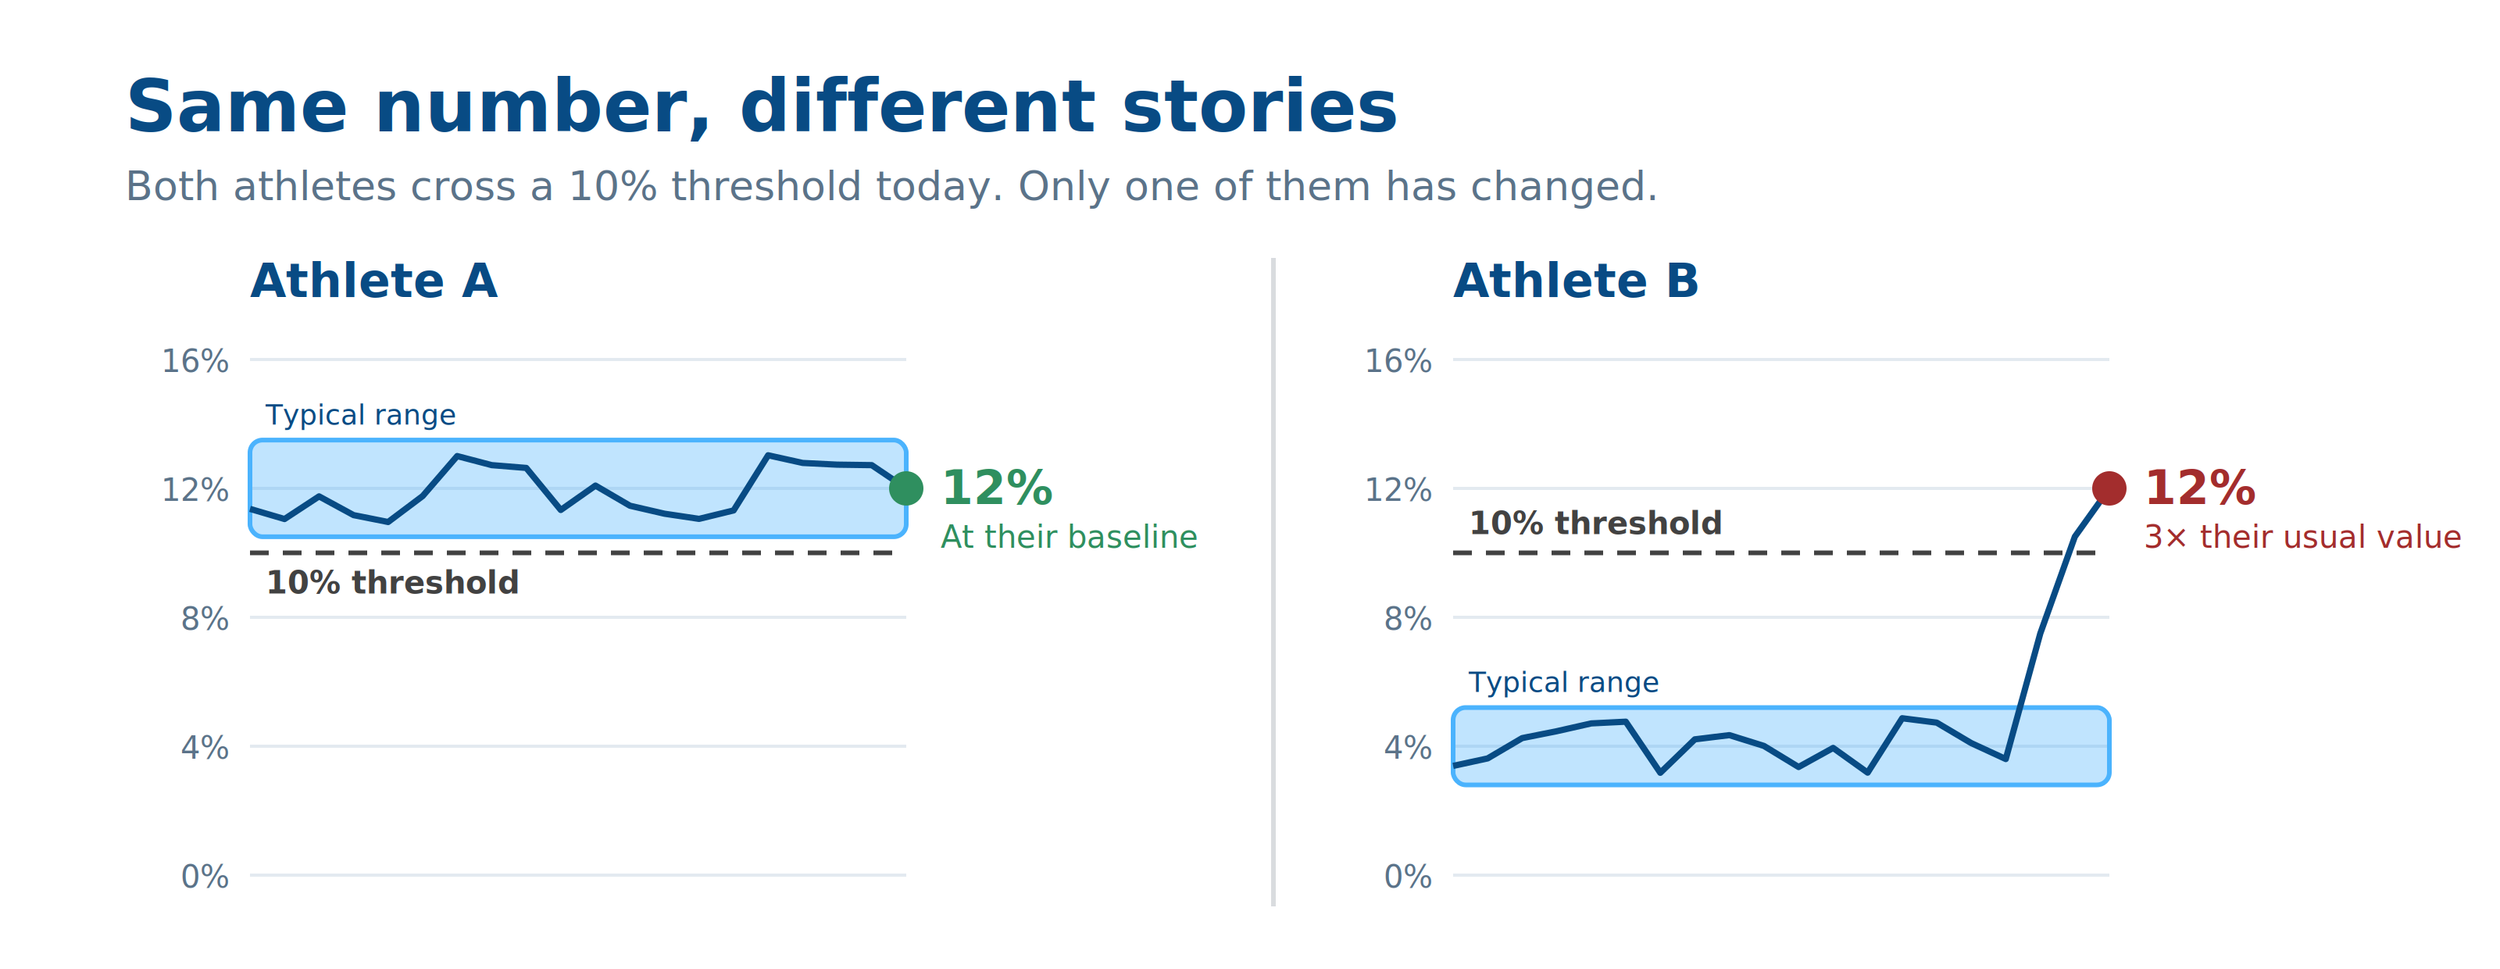
Consider two athletes, both showing 12% asymmetry in impact.
Athlete A has measured around 12% all season. Nothing has changed.
Athlete B usually sits at 4%. Their 12% is a three-fold shift from their own normal.
Same number. Different stories. A population threshold treats them identically. Their own baselines tell you one is stable and the other has changed.
The reverse also happens. An athlete can sit comfortably "within normal range" and still be well off their own baseline. If you only compare to the population, that change stays invisible.
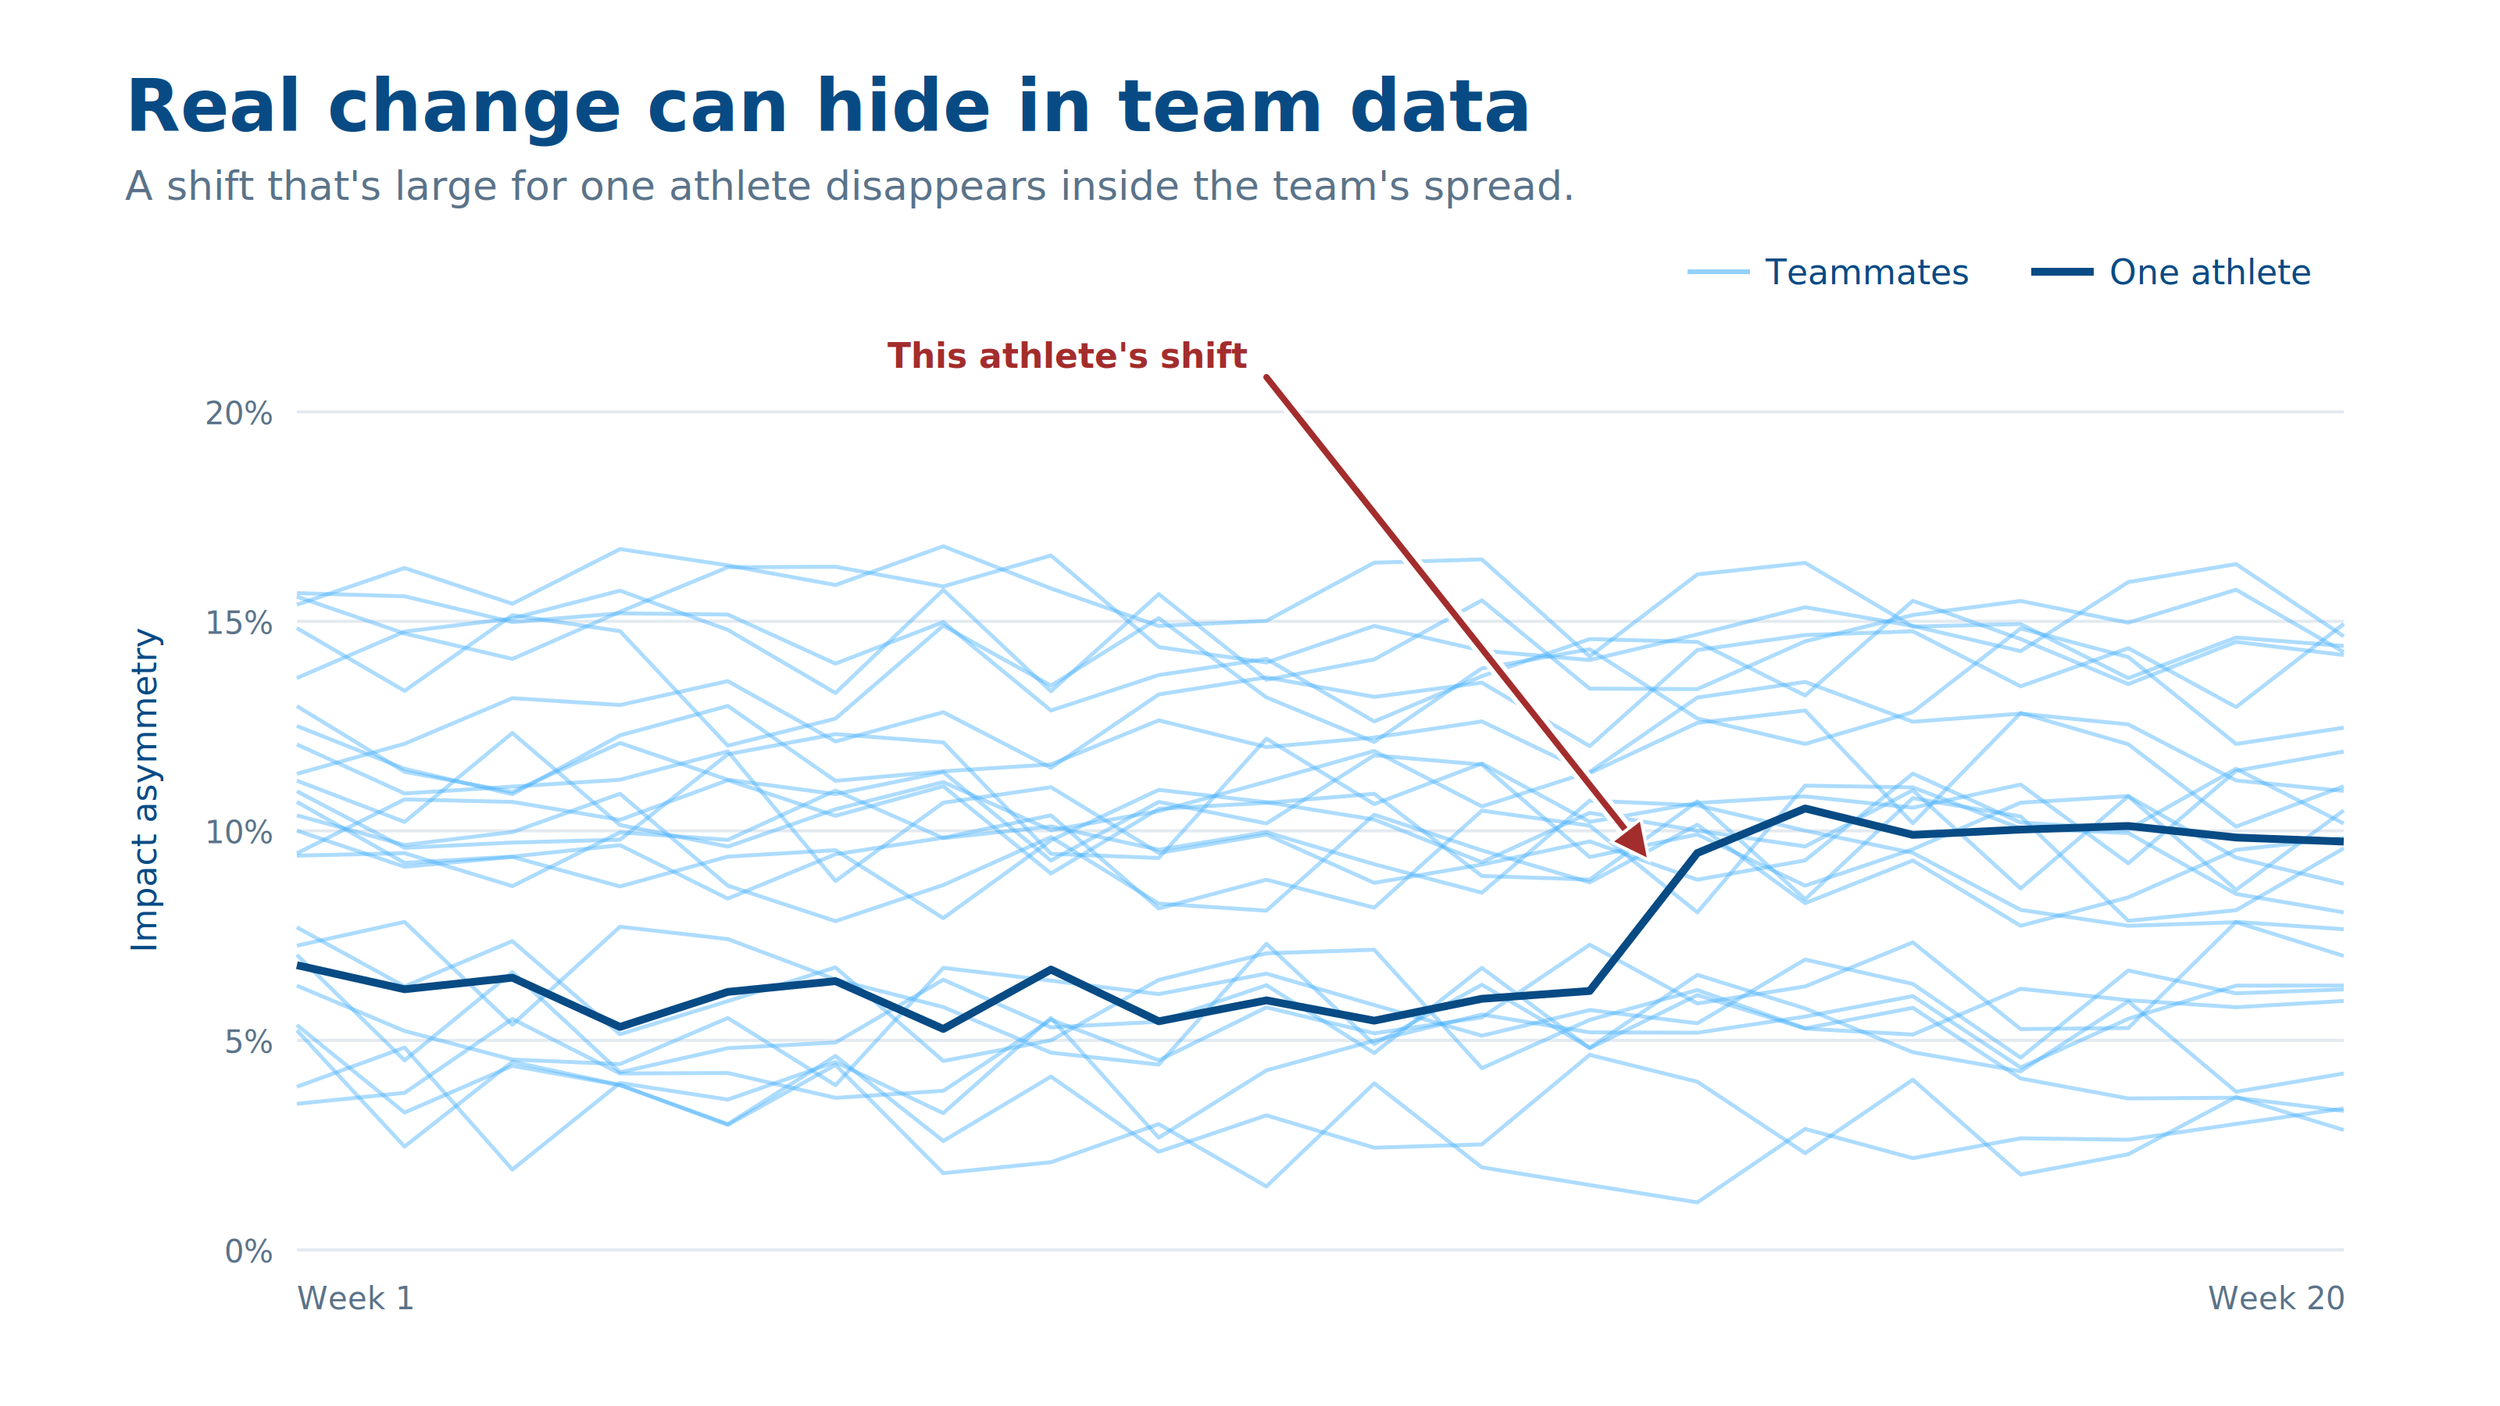
Scale matters too. The week-to-week variation within one athlete is usually much smaller than the spread across a team. A shift that's meaningful for an individual can disappear completely inside group-level data.
What individualization requires
Comparing athletes to themselves sounds simple. In practice it requires a few things most programs don't yet have.
Repeated measurement. A single test is a snapshot. A baseline comes from many data points over time, enough to know what typical variation looks like for that athlete.
Real-world context. Movement in a lab can differ from movement in training and competition. Baselines are most useful when collected where the athlete actually moves.
Data before it's needed. The most valuable baseline is the one captured before an injury. Reconstructing "normal" after the fact means guessing, often with population averages.
Design for the individual
The Air Force didn't solve its problem by finding a better average. It solved it by designing for variation.
Sport science can do the same. Use averages to orient yourself. Then measure each athlete often enough to know what normal looks like for them, and judge every change against that.
The best time to start building those baselines is before you need them.
Sources
Daniels, G. S. (1952). The "Average Man"? Technical Note WCRD 53-7. Wright Air Development Center, Wright-Patterson Air Force Base, Ohio.
Rose, T. (2016). The End of Average: How We Succeed in a World That Values Sameness. HarperOne.
Rose, T. (2016, January 16). When U.S. air force discovered the flaw of averages. Toronto Star.